

Image Source: CME Group
AT-A-GLANCE
- Supply chain disruptions and the relative demand shift away from services and into goods both combined to lift inflation above 6% in 2021.
- The shape of the yield curve is likely to shift depending on the relative mix of expectations about the Fed pushing short-rate higher, whether future inflation will decline quickly or not, and how well equity markets absorb the changes in Fed policy.
- U.S. Treasury 10-year yields over the course of history have tended to embed a risk premium for future inflation. That risk premium was erased by quantitative easing and low rates in the 2010-2021 period. Will it reemerge once QE has ended and short-term rates are rising?
- When one is uncertain about the future course of inflation and the economy is doing quite well, one policy choice might be to adopt a neutral short-term interest rate policy. Our analysis suggests the Fed might consider a neutral policy to be one in which the target range for the federal funds rate was more or less on top of the Fed’s 2% long-term inflation target.
- The Fed has guided that it wants to end QE before considering raising short-term rates. Technically, however, it is possible for Fed to raise rates and continue with asset purchases, even if that is not likely. That is, lift-off for higher rates does not technically depend on Fed asset purchases ending.
U.S. Treasury yields are on the move. Inflation is elevated. Labor markets are doing very well and unemployment is declining. Real GDP has surpassed the pre-pandemic peak. The Federal Reserve (Fed) is withdrawing from its asset purchase program (aka QE) and may end net asset purchases in the first half of 2022. After QE has been terminated, then the Fed will consider raising its target range for the federal funds rate. All the while, Covid-19 complicates the picture with new variants. In this essay we examine five questions that are key to how yields on U.S. Treasuries may move in 2022, and how the shape of the yield curve may change.
1) Inflation: Driven by Supply or Demand?
Was the 6%-plus elevated inflation rate observed in 2021 supply or demand driven? Both. Every product or service that changes hands has a seller (supply) and a buyer (demand), so the analysis of why prices move always involves both supply and demand. In the case of the pandemic, supply and demand were impacted in very unusual and atypical ways.
The two major changes on the demand side were, 1) the direct payments to individuals by the U.S. federal government to cushion the blow from the partial shutdown of the service sector, and 2) the shift in consumption patterns away from services and toward goods.
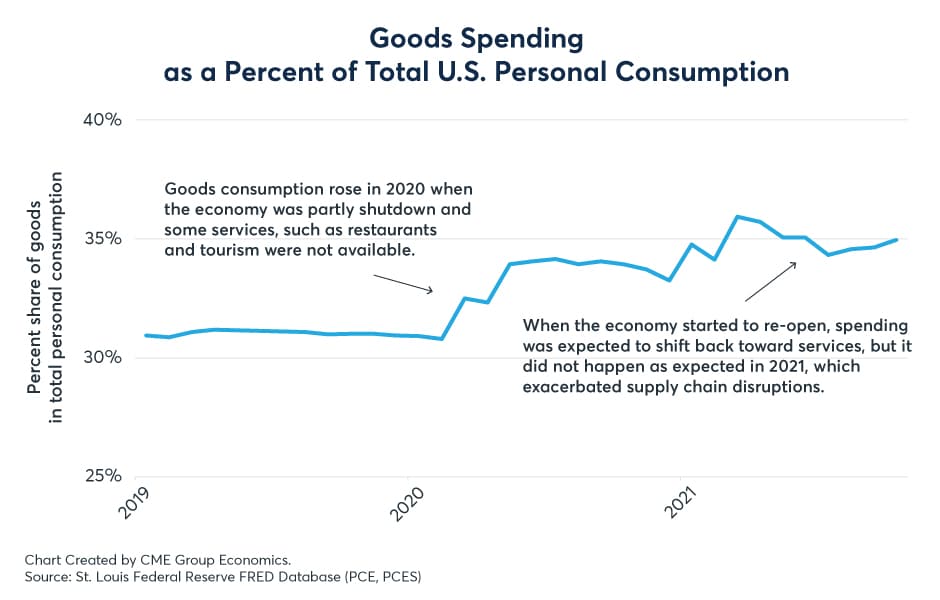
First, the direct payments to individuals allowed a much more rapid recovery of personal consumption back to pre-pandemic levels than otherwise would have been possible, and by end-2021, real GDP was about 3.5% above the pre-pandemic peak in Q4/2019. The 3.5% growth over two years was an amazingly rapid recovery from the pandemic shock, yet was well below average demand growth for a two-year period. So, we do not give much general demand-side credit to fiscal policy in terms of influencing the elevated rate of inflation observed in 2021 even if it helped create a more rapid recovery from the shock. Second, the relative shift away from spending on services to goods was a major upward demand shock for goods that exacerbated supply-chain challenges and impacted goods inflation in 2021. That is, the demand influence that was important for inflation came from a relative shift in demand from services to goods and not an overall, persistent increase in general demand.
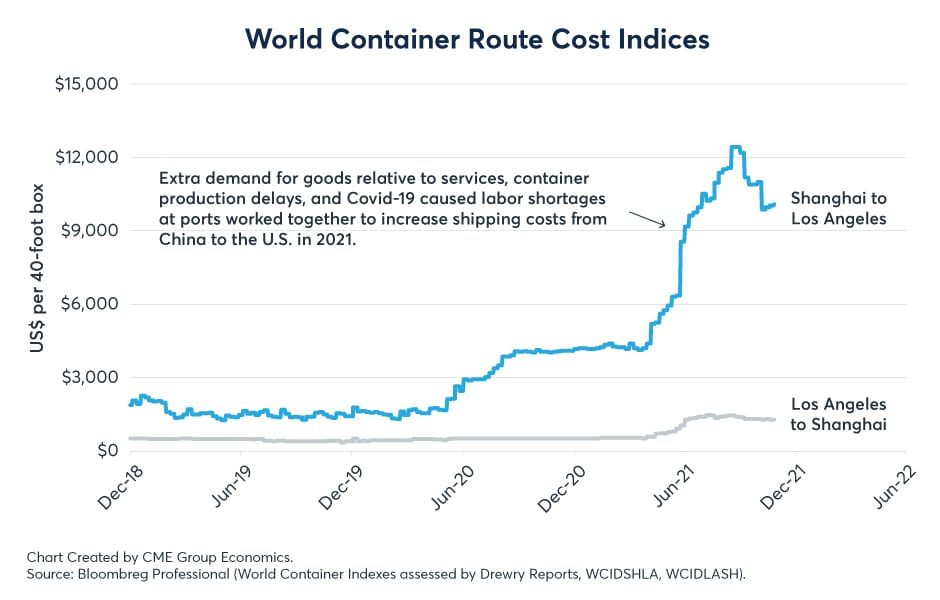
On the supply side, there were myriad challenges. In some cases, ports were impacted by COVID-19, which disrupted the loading and unloading of containers. Container production slowed in the spring of 2020, and then took time to ramp back up to meet the rising exports of goods coming from China to the U.S. and Europe, due to the relative shift to consumption of manufactured goods. The shift to goods also resulted in computer chips being in short supply, leading to a slowing of automobile production, and pushing the prices of used cars to all-time highs. These were just a few of the many supply chain disruptions induced by the pandemic.
Figure 1: Personal Consumption
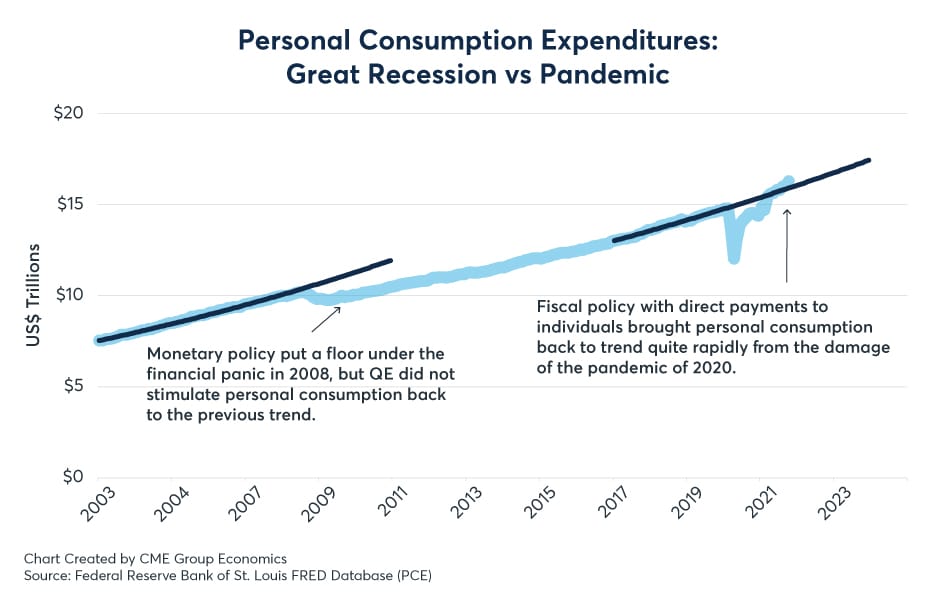
Figure 2: Goods Spending
Taken together in our perspective, supply-chain disruptions due to COVID-19 and the relative shift to goods consumption get most of the credit for the elevated rate of inflation that developed in 2021. This analysis has important policy implications because typical demand-side policy responses, such as raising interest rates, cannot cure supply disruptions, especially those due to COVID variants that might disrupt international transportation and other aspects of the supply chain. Still, in late 2021, with real GDP fully recovered, labor markets robust, and inflation elevated, the demand-supply combination worked to impact expectations that the U.S. Federal Reserve (Fed) might eventually return to a neutral monetary policy; that is, no asset purchases and short-term rates more or less aligned to the Fed’s 2% inflation target, sooner rather than later.
Figure 3: Used Cars
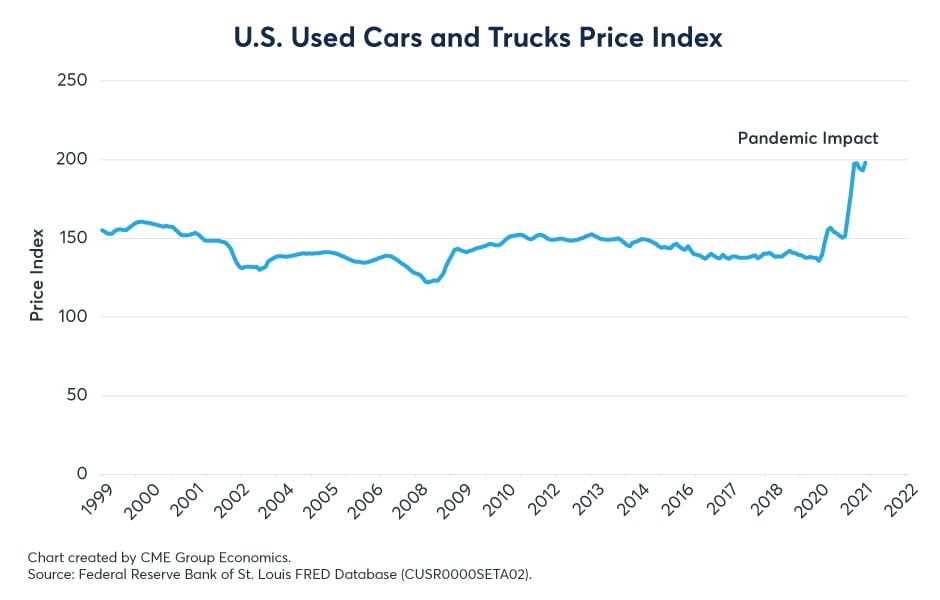
Figure 4: Shipping Costs
2) Yield-Curve Scenarios
How might the U.S. Treasury yield curve respond to higher short-term rates? Not clear. There are no less than three plausible scenarios being debated: 1) flattening, 2) steepening, and 3) a parallel shift upward. Let’s examine each scenario from the perspective of the yields on U.S. Treasury 2-year and 10-year notes.
First, as always, context matters. In late 2021, consumer price inflation above 6% was elevated well over the Fed’s 2% target. Real GDP had fully recovered from the pandemic shock, and labor markets were robust with falling unemployment, record job openings, and elevated voluntary job quits. In response, the Fed decided to start the process of ending its asset purchase program (aka QE), and market participants began to debate when the Fed would commence raising short-term interests as well as how high they might eventually go.
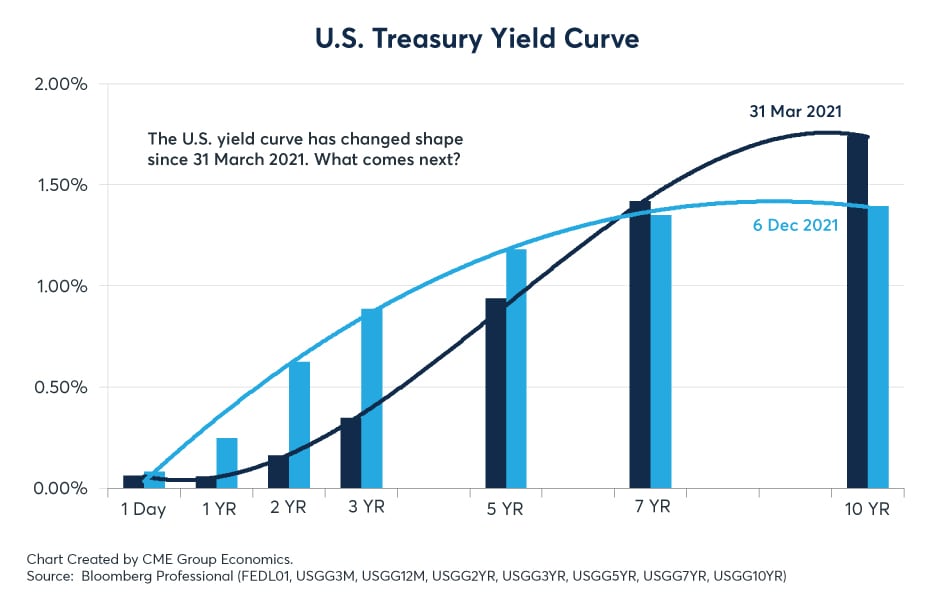
In scenario #1, a flattening of the Treasury yield curve would mean that yields on the 2-year would rise relative to yields on the 10-year. In scenario #2, a steepening of the Treasury yield curve would mean that yields on the 10-year would increase relative to yields on the 2-year. Scenario #3 is where the yields on both the 2-year and the 10-year go up (or down) in tandem; that is a parallel shift in the whole curve.
Figure 5: U.S. Treasury Yields
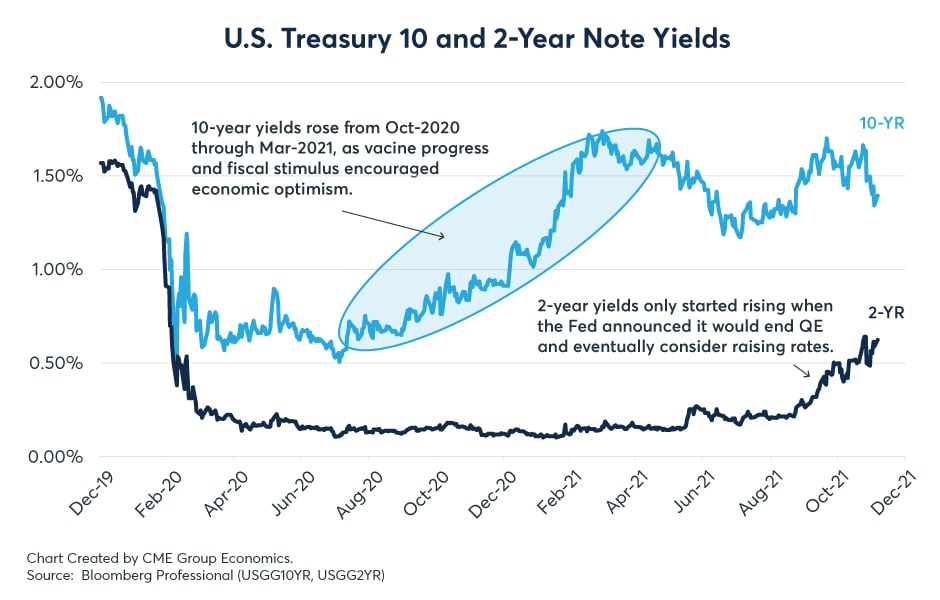
Figure 6: Yield Curve
What would be the key driver of each scenario?
The flattening scenario might occur if inflation in 2022 started to decline quickly back toward the Fed’s 2% target or if equity markets swooned and there was a flight-to-quality to longer-term U.S. Treasuries. Then, one could envision 2-year yields rising as the Fed commenced raising short-term rates, while the 10-year would respond less with inflation decelerating or equities weakening. For example, in late November and early December 2021, short-term yields rose while the yield on the 10-Year declined, in part due to equity market nervousness.
By contrast, the steepening scenario might occur if inflation, especially core inflation (excluding food and energy) remained elevated above 3% and did not seem to be decelerating back to the Fed’s 2% target. In this case, while 2-year yields might rise with the Fed raising short-term rates, 10-year yields might rise relatively more, moving upward to meet the apparently persistent core inflation rate, because they would no longer be held artificially lower due to the Fed having ended its asset purchase program.
The parallel upward shift scenario suggests the Fed raises short-term rates in regular steps, perhaps every other FOMC meeting while inflation stays elevated, and critically, the Fed is perceived as doing “too little, too late,” making the end-point for rate hikes highly uncertain.
It is a fascinating market debate, and only time will tell which scenario ultimately becomes reality. Indeed, at various times, all three scenarios might have there day in the sun.
3) What will market assign as an inflation risk premium?
In the past, what has been the driver of the inflation risk premium embedded in U.S. Treasury 10-year yields? The relationship of the U.S. Treasury Note 10-year yield to the observed inflation rate is all about context and expectations. We will highlight these key factors across four periods: 1) the inflationary 1970s, 2) the disinflationary 1980s, 1990s, and early 2000s, 3) the low rates and quantitative easing or QE period from 2011 through 2019, and 4) the post-pandemic inflation period starting in 2021.
Figure 7: Core Inflation and Yields
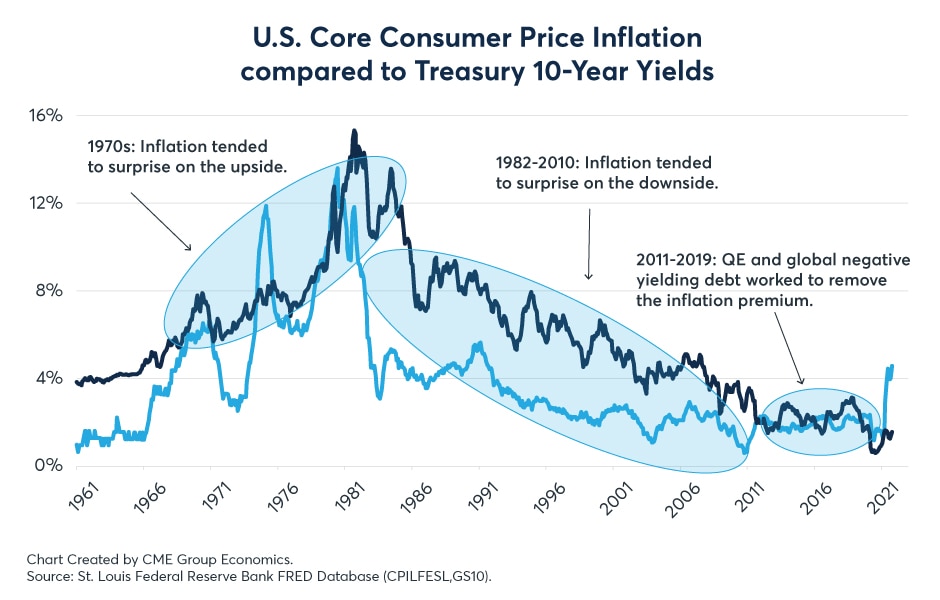
Figure 8: Negative Yielding Debt

In the inflationary 1970s, there was both an accommodative monetary policy and OPEC oil price shocks, which led actual inflation to surprise market expectations to the upside. This meant that the inflation premium embedded in 10-year note yields was eroded, as rises in Treasury yields lagged the unexpected increases in the inflation rate. In the 1980-82 period, super-high short-term interest rates caused a recession and broke the back of inflation. For the next 30 years, observed inflation decelerated, yet it took time (i.e., decades) for inflation fears to subside and the inflation premium to shrink. During this 1980s, 1990s, and early 2000s period, inflation consistently surprised on the downside, and it took yields decades to catch up to the new reality of sustained low inflation.
The advent of Fed quantitative easing and an era of low short-term rates following the Great Recession of 2008-2009 changed the context. There is a saying in the markets – “don’t fight the Fed” – and with Fed buying Treasuries, the European Central Bank (ECB) pushing yields into negative territory, and with low short-term rates in all the major countries; well, the inflation premium completely disappeared.
2022 involves a new reality, and the transition started in late 2021. Inflation shot upwards in late 2021 in the post-pandemic economy with myriad supply disruptions. New COVID variants have the potential to cause more supply chain issues. The Fed announced it would end its asset purchases by mid-2022 or sooner, and then consider raising short-term rates. The ECB is moving relatively slower, so as 2022 commences, there is still some downward pull-on U.S. Treasury yields from the global overhang of negative-yielding debt; and the U.S. dollar is strong, which historically has helped to contain inflation.
Will 10-year Treasury yields rise to embed an inflation premium once again? That is big question for bond markets to answer in 2022.
4) What is a Neutral Fed Policy?
What is a neutral rates policy? One interpretation is that a neutral Fed policy would put the federal funds rate target range more or less on top of the Fed’s 2% inflation target.
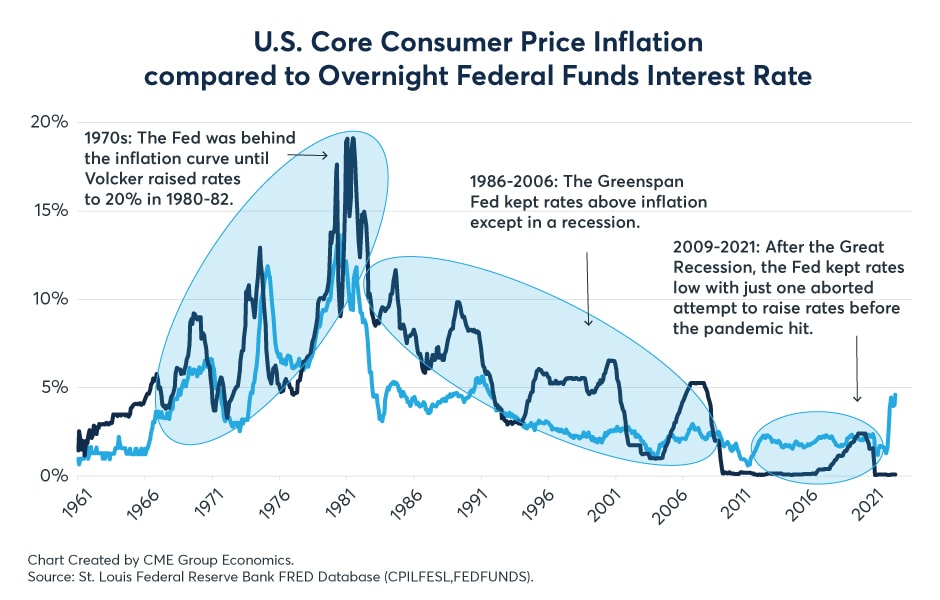
The understanding of neutral used to be different from this. Under former Fed chair Greenspan in the 1990s, neutral would have meant putting the federal funds rate above the prevailing rate of inflation by about 1% or 2%. Since the Great Recession of 2008, however, the view of Fed neutrality appeared to shift away from providing an inflation premium on overnight interest rates and to assume (rightly or wrongly) that inflation would be mean-reverting and eventually come back in line with the Fed’s 2% inflation target.
Figure 9: Inflation and Federal Funds
While only time will tell, as 2021 ended, the case for the Fed exiting its asset purchase program and eventually lifting short-term rates was supported by 1) the upward trend in equities, 2) the full recovery of U.S. real GDP from the pandemic shock, and 3) the robustness of the labor market, with unemployment declining, job openings at record highs, and voluntary job quits elevated, all in the context of overall consumer price inflation above 6% and core inflation, excluding food and energy, over 4%. The debate within the Fed’s Federal Open Market Committee (FOMC) may revolve in 2022 around the thinking that when general economic demand is not the problem and supply-disrupted inflation is expected to last through 2022 and maybe a little longer, a possible course the Fed might choose is to go to “neutral” until the course of future inflation is better understood.
5) Rate Lift-Off versus Asset Purchases
Could the Fed commence raising short-term rates before it terminates its asset purchase program? Yes, technically it is possible for the Fed to raise rates and simultaneously purchase assets, if it wanted to do so. The Powell-led Fed, however, has clearly guided that it believes it is inconsistent to be purchasing assets and raising rates at the same time. So, the timing for rate lift-off is likely on or before the summer of 2022, only once the asset purchase program has ended.
The technical aspects of how short-term interest rate rises are enforced is worth an examination. The Fed effectively influences the overnight money markets by the interest rate the Fed pays on the deposits, or reserves, held by financial institutions at the Fed. In Q4/2021 the Fed was paying 15 basis points or 0.15% on deposits at the Fed, aka federal funds. Federal funds traded among depository institutions typically trade for a little less. For example, in Q4/2021, with the interest paid on reserves at 0.15%, federal funds were trading 7 basis points less, at or around 0.08%, which was within the 0% to 0.25% target range of the Fed for the federal funds rate at that time. This means, that if the Fed, hypothetically, wanted to raise the federal funds target range to 0.75% to 1.00%, then it would need to set the interest rate paid on reserves to around 0.90% to push the federal funds rate into the middle of the target range.
If the Fed wants to raise rates, it just has to pay more interest on reserves held at the Fed, which it can do at any time, regardless of whether the Fed is buying assets or not. There is a cost, however. When the Fed raises the rate it pays on reserves, the Fed will incur increased interest expense, and this will reduce the net profits of the Fed, which it contributes to U.S. Treasury and were about $100 billion in fiscal year 2021.
Figure 10: Interest on Reserves

The preceding post was written and/or published as a collaboration between Benzinga’s in-house sponsored content team and a financial partner of Benzinga. Although the piece is not and should not be construed as editorial content, the sponsored content team works to ensure that any and all information contained within is true and accurate to the best of their knowledge and research. The content was purely for informational purposes only and not intended to be investing advice.
© 2025 Benzinga.com. Benzinga does not provide investment advice. All rights reserved.
Trade confidently with insights and alerts from analyst ratings, free reports and breaking news that affects the stocks you care about.

