This post contains sponsored advertising content. This content is for informational purposes only and not intended to be investing advice.
AT-A-GLANCE
- Relative monetary policy: Expectations for rapid Fed rate rises have also boosted USD
- Relative growth: The U.S. economy has also been growing much more quickly than Japan’s recently
- The U.S. government spending is shrinking much more quickly while the Japanese budget deficit continues to grow with increased spending and debt finance.
- Higher energy prices/falling trade surpluses have weighed on JPY
- Increased relative risks, especially as regards JPYs role in the FX carry trade weigh against the yen.
Over the past fifteen months the U.S. dollar (USD) has gained more than 20% versus the Japanese yen (JPY) with nearly half the move coming during the past few weeks. The yen’s recent decline can be understood when looking at the five macroeconomic forces that tend to govern exchange rates:
- Relative changes in the pace of economic growth
- Relative changes in expected interest rate policy
- Relative changes in government spending policies
- Relative changes in export growth
- Relative changes in risk assessment

Scan the above QR code for more expert analysis of market events and trends driving opportunities today!
Sometimes these forces pull in opposite directions. When this is the case, a currency pair will often show little direction and move sideways. At times, however, one or more of the forces becomes dominant and the exchange rate will begin to trend in one direction or the other. In the case of the JPYUSD exchange rate, all five forces have begun pulling the same direction.
Current Account Surpluses/Deficits and Energy Prices
According to SWIFT the yen is the third most widely used currency the world for international trade, behind the U.S. dollar and the euro. Even so, it is used in only 3% of global commercial transactions compared to around 80% for the dollar. As the global reserve currency, USD is structurally advantaged due to the U.S. dollar’s status as a global reserve currency. The U.S. dollar is the far dominant numeraire for commodity trading, the leading asset in central bank foreign reserve portfolios, and serves as a global flight-to-quality currency. All of these advantages have led to the U.S. running chronic trade deficits that have varied from 2% to 6% of GDP so far this century, as natural offsets to the inbound capital flows that accrue to the world’s primary reserve currency. By contrast, the Japanese yen enjoys no special reserve currency status, and its trade flows depend mostly on the global demand for its exports. Japan tends to run trade surpluses, but size of those surpluses varies over time (Figure 1), as global demand for Japan’s exports wax and wane.
Figure 1: Japan tends to run surpluses, the U.S. deficits but the sizes vary over time

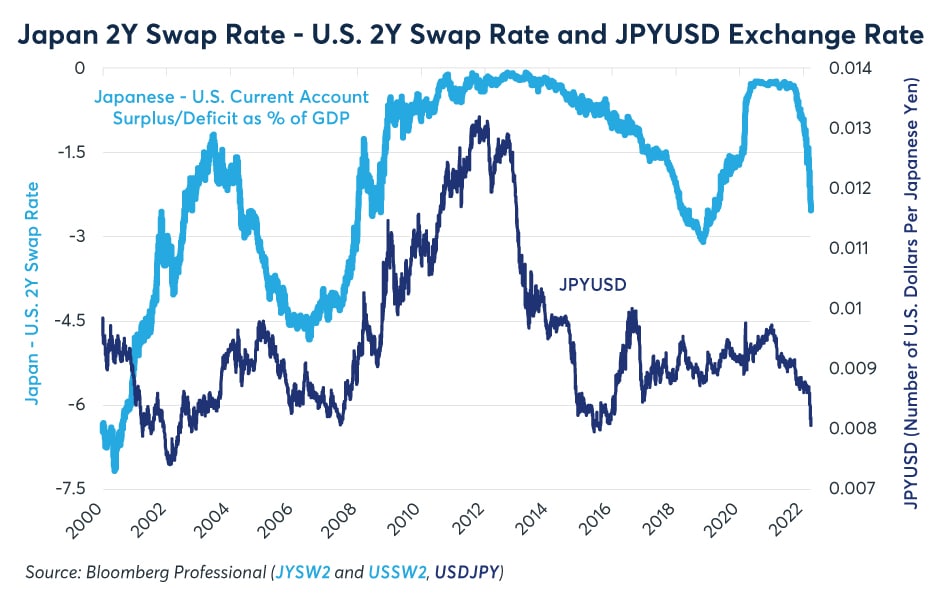
When Japan’s current account surplus is growing as a percentage of GDP relative to the U.S. current account, JPY tends to rise in value. The opposite tends to happen when Japan’s current account surplus shrinks relative to the U.S. (Figure 2).
Figure 2: When Japanese surpluses expand relative to the U.S., JPY tends to strengthen

Japan’s surplus expanded relative to the U.S. during the early stages of the pandemic as global consumer spending shifted towards buying factory made goods. Being a major exporter of manufactured items, Japan’s current account surplus expanded while the U.S. current account deficit grew. This may explain in part why the yen strengthened in 2020. However, in 2021 and 2022, the yen reversed course especially as energy prices soared. Higher energy prices have little overall impact on the U.S. which is a major exporter of natural gas and produces most of its own crude oil. However, Japan imports 98% of its crude oil and most of its natural gas and coal. As such, higher energy prices threaten to erode Japan’s current account surplus relative to the U.S. to the disadvantage of the yen.
Of particular concern has been the gap between the Eurasian price of natural gas and the U.S. price. While crude oil prices rarely vary more than a few percentage points from one region of the world to another, the natural gas market remains much more compartmentalized. For much of 2019, Japan and Korea paid around $6.5 per MMBtu for natural gas which was about 3x higher than the U.S. price at the time. By 2020, the Platts Japan-Korea Marker (Platts JKM) price had converged with the U.S. price. By the fall of 2021, however, the U.S. price rose from $2.5 to around $5.0 whereas the Platts JKM price varied from $20-57 per MMBtu (Figure 3). Japanese natural gas prices are now averaging around 8-10x the U.S. price. This raises the cost of electricity in Japan as well as the cost basis for Japan to manufacture goods, simultaneously increasing the cost of Japan’s exports while also significantly increasing its cost of imports. The Russo-Ukrainian conflict has exacerbated these concerns.
Figure 3: Higher energy prices are likely to reduce Japan’s trade surplus

Interest Rate Differentials
Expectations for U.S. Federal Reserve (the Fed) and Bank of Japan (BoJ) short-term interest rates also influence the JPYUSD exchange rate. Over the past two decades most of the action has been on the Fed side of the equation as the BoJ has, with a few exceptions, left policy rates near zero. And, the BoJ also has an explicit yield curve control policy capping the yield on Japanese Government Bonds (JGBs) at around 20 basis points or 0.20%, unlike the Fed which has guided that it intends to shrink its balance sheet, an action that is putting upward pressure on U.S. Treasury 10-year Note yields.
When the Fed is expected to raise rates relative to the BoJ, the dollar tends to strengthen and when the Fed cuts rates relative to the BoJ, the dollar tends to weaken. In the past six months there has been a sea change in expectations for the Fed, going from essentially no expectation of Fed rate hikes in early October to now pricing that the Fed will hike rates to between 2 and 3% over the next two years (and possibly higher). By contrast, there has been no similar move in expectations for the BoJ which is still dealing with inflation that is barely positive compared to near 8% inflation rates in the U.S. (Figures 4 and 5).
Figure 4: Expectations have formed for a rapid rise in U.S. rates

Figure 5: Expectations for tighter monetary policy in the U.S. tend to support the dollar

Comparative Government Spending Policies and Relative Economic Growth
While Japan has tended to run large current account surpluses, it has a parallel tendency of running extremely large budget deficits, with aggressive government spending financed by debt at low rates held down by the BoJ yield curve control policies. For many years, Japan consistently ran deficits of 6-8% of GDP. Over the past three decades the combination of increased government spending financed by debt and slow growth in nominal GDP has expanded Japan’s public debt to GDP ratio from below 60% of GDP to over 200%. By contrast, the U.S. public debt hasn’t risen as much (from 68% of GDP thirty years ago to around 110% today). Moreover, U.S. budget deficits have shown more variation ranging from surpluses in the late 1990s to deficits as wide as 20% of GDP in 2020, when the U.S. spent massively to support the economy during the pandemic. As we enter the post-pandemic or endemic phase, fiscal support has been withdrawn, and the U.S. budget deficit has been shrinking rapidly from 19.7% of GDP in the year to March 2021 to around 10% of GDP today. Japan’s budget deficit, by contrast, as 13% of GDP in 2020 and shrank to around 8% of GDP in 2021. The more rapid expansion of the U.S. budget deficit likely weighed on USD in 2020 while the more rapid narrowing might support the dollar now.
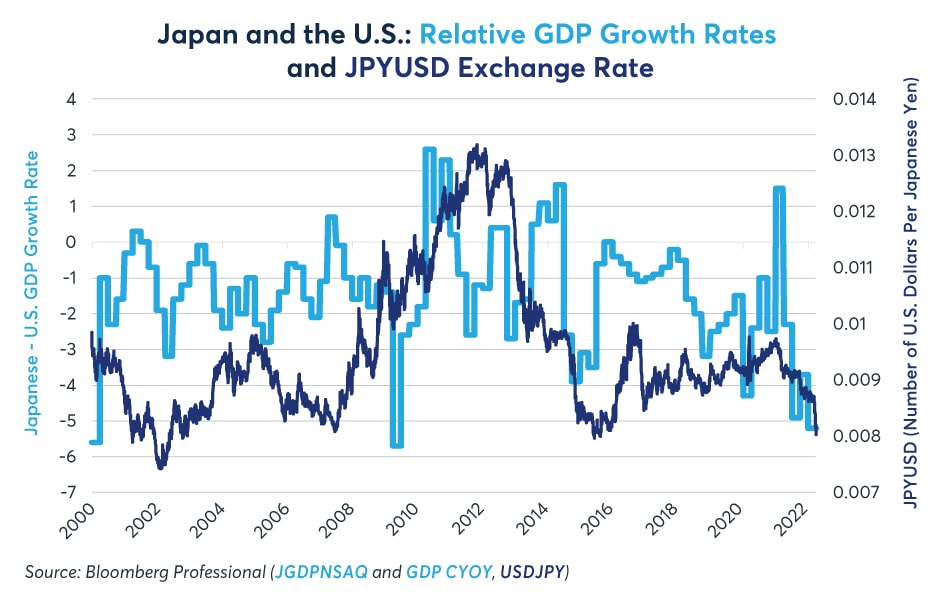
In terms of relative growth rates, the U.S. has tended to expand more quickly than Japan, owing in large part to a more rapid rise in population. That said, there have been two periods in which Japan’s economy outperformed: 2010-11 and in 2020. In both cases, the yen strengthen during or shortly after the period in which Japan was growing more quickly than the U.S. (Figures 6 and 7).
Figure 6: U.S. growth has recently outpaced Japanese growth by a wide margin

Figure 7: Slower growth in Japan has tended to weigh on the yen

Recently, however, Japan’s economic growth rate has slowed to close to zero while U.S. growth remains robust (Figure 8, 9 and 10). As noted earlier, the U.S. offered a great deal more fiscal stimulus than Japan did during the pandemic and the global shift back towards spending on services and away from buying manufactured goods may dent Japan’s growth rate.
Figure 8: The relative expansion of the BoJ balance sheet appears to have weighed on the yen

Figure 9: U.S. growth has recently outpaced Japanese growth by a wide margin

Figure 10: Slower growth in Japan has tended to weigh on the yen

Risk Factors That Could Reverse the Yen’s Downtrend
A global decline in commodity prices, and especially energy prices, would likely boost the yen by improving Japan’s terms of trade. Also, the yen is often used as a flight to quality instrument by Japanese investors and corporations. If there was a severe correction in global equity markets that caused U.S. fixed income investors to downgrade the pace at which they expect the Fed to hike rates, that might also cause JPY to reverse course and rebound versus USD.
Eventually a weaker yen should boost Japanese exports by lowering their cost relative to other producers. Moreover, the Fed’s rate hikes could significantly slow the pace of growth in the U.S. over time, although the economy tends to react to tighter monetary policy with a delay of six months to as long as two years.
There is an additional risk for the JPY in global currency markets. Of the three major central banks, the U.S. Fed is already withdrawing accommodation, the European Central Bank (ECB) may follow in the second half of 2022, but the BoJ is not expected to shift policy accommodation as it welcomes the arrival of inflation to completely break the psychology of deflation that it feels has held the economy back over the last several decades. This means that the JPY might face the most pressure among the majors, and in competition with emerging market currencies offering relatively high interest rates.
This post contains sponsored advertising content. This content is for informational purposes only and not intended to be investing advice.
© 2025 Benzinga.com. Benzinga does not provide investment advice. All rights reserved.
Trade confidently with insights and alerts from analyst ratings, free reports and breaking news that affects the stocks you care about.