Zinger Key Points
- The SPY hit resistance on Friday at $421.67 and wicked down slightly from the level.
- Bullish traders want to see big bullish momentum break the SPY up above the area.
- Get access to your new suite of high-powered trading tools, including real-time stock ratings, insider trades, and government trading signals.
The SPDR S&P 500 SPY closed up 1.3% on Friday ahead of news over the weekend that President Joe Biden and House Speaker Kevin McCarthy reached a deal to increase the debt ceiling.
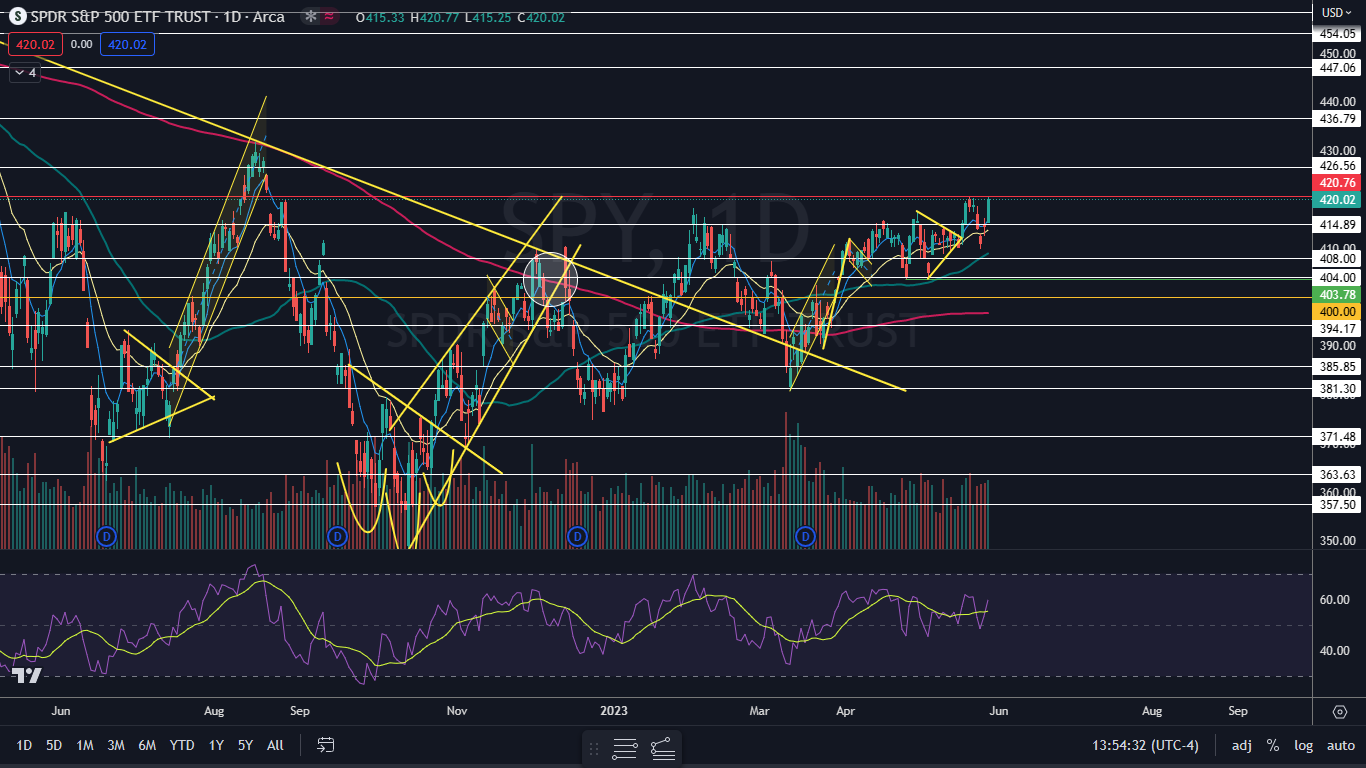
The move higher in the market ETF caused the SPY to bump into resistance at $420.76 and wick slightly down from the area.
While the agreement between Biden and McCarthy must still pass through the House and Senate to gain approval, the news was positive for the stock market.
"The agreement prevents the worst possible crisis, a default, for the first time in our nation's history," Biden said at the White House. "Takes the threat of a catastrophic default off the table."
However, the bullish momentum could be extinguished by the Federal Reserve, whose members — set to meet June 13 and June 14 — decide whether to continue hiking interest rates.
Heading into the meeting, the SPY could experience levels of volatility. Traders wishing to trade the volatility in the stock market can use MIAX’s SPIKES Volatility products. The products, which are traded on SPIKES Volatility Index (SPIKE), track expected volatility in the SPDR S&P 500 over the next 30 days.
Want direct analysis? Find me in the BZ Pro lounge! Click here for a free trial.
The SPY Chart: The SPY printed bullish Marubozu candlestick on Friday, which suggests the ETF may trade higher on Monday. The second most likely scenario is that the SPY trades sideways, forming an inside bar pattern, which would lean bullish for continuation later in the week.
- If the SPY pops up above $421, the area will become support and bullish momentum could enter to drive the ETF higher. If the SPY trades slower, a triple top pattern will have developed, which could suggest lower prices or longer-term consolidation is on the horizon.
- If the SPY retraces, traders want to see the ETF form a bullish reversal candlestick, such as a doji or hammer candlestick, above the 50-day simple moving average.
- The SPY has resistance above at $420.76 and $426.56 and support below at $414.89 and $408.
Image: Shutterstock
© 2025 Benzinga.com. Benzinga does not provide investment advice. All rights reserved.
Trade confidently with insights and alerts from analyst ratings, free reports and breaking news that affects the stocks you care about.
 Now Read: