Zinger Key Points
- The U.S. Bureau of Labor Statistics reveals rising prices for Thanksgiving staples, challenging Biden's claims of low grocery inflation.
- Despite the White House's claims, key Thanksgiving foods like turkey, potatoes and sauces have surged in price over the past five years.
- Get Pro-Level Earnings Insights Before the Market Moves
As President Joe Biden celebrated his 81st birthday this week by pardoning National Thanksgiving Turkeys and cracking jokes about his age, the White House put forth a rosy picture of the nation’s grocery inflation, claiming it to be at its lowest level in more than two years.
However, a different narrative emerged when the U.S. Bureau of Labor Statistics (BLS) presented its findings on Thanksgiving’s price pressures.
“The cost of a Thanksgiving dinner fell this year, with prices down for turkey, stuffing, peas, cranberries, pie crust and whipping cream,” declared the White House in a statement, citing reports from the American Farm Bureau.
When examining the official statistics, the BLS painted quite a distinct picture with its Thanksgiving-adjusted Consumer Price Index (CPI), encompassing items like turkey, mashed potatoes, sauces and gravies, fresh biscuits, rolls, muffins and pie.
The results contradicted the White House’s claims.
Your Thanksgiving Turkey Costs Nearly 50% More Than 5 Years Ago
“Prices consumers paid for other uncooked poultry, including turkey, were 7.2% higher in October 2023 than in October 2022. Prices increased 16.9% in the same period one year ago. From 2000 to 2023, prices rose at a 3.0-percent annual rate from one October to the next,” stated the BLS.
The fact that turkey’s inflation had dropped from 16.9% to 7.2% didn’t mean prices had decreased. A 7.2% inflation rate still signifies rising prices for this item, albeit at a slower pace than the previous year.
Over the last five years, the average annual inflation for “other uncooked poultry, including turkey,” stood at 8.1%, according to BLS data. In essence, an average American consumer now spends 46% more on preparing a Thanksgiving turkey compared to five years ago.
And the story wasn’t much different from other popular Thanksgiving foods.
Potatoes had surged by 23.7%, sauces and gravies by 32%, fresh biscuits by 30%, and bakery products such as pies, tarts, and turnovers by 30% over the same time frame.
Table: Annual Inflation Rate On Thanksgiving-Related Foods
| Year | Other uncooked poultry including turkey | Potatoes | Sauces and gravies | Fresh biscuits, rolls, muffins | Frozen and refrigerated bakery products, pies, tarts, turnovers |
|---|---|---|---|---|---|
| 2019 | 3.5 | 8.9 | 0.4 | 0.7 | -0.3 |
| 2020 | 11.3 | 0.3 | 4.9 | 3.2 | 2.6 |
| 2021 | 1.7 | 1.7 | 1.8 | 4.8 | 4.1 |
| 2022 | 16.9 | 15.2 | 14.6 | 13.6 | 18.6 |
| 2023 | 7.2 | -3.3 | 7.5 | 5.7 | 2.7 |
| Avg | 8.12 | 4.36 | 5.84 | 5.2 | 5.34 |
| 5-Year Cumulative Increase | 46.8 | 23.7 | 32.1 | 30.1 | 29.7 |
Grocery Inflation Has Moved Faster Than Overall Inflation
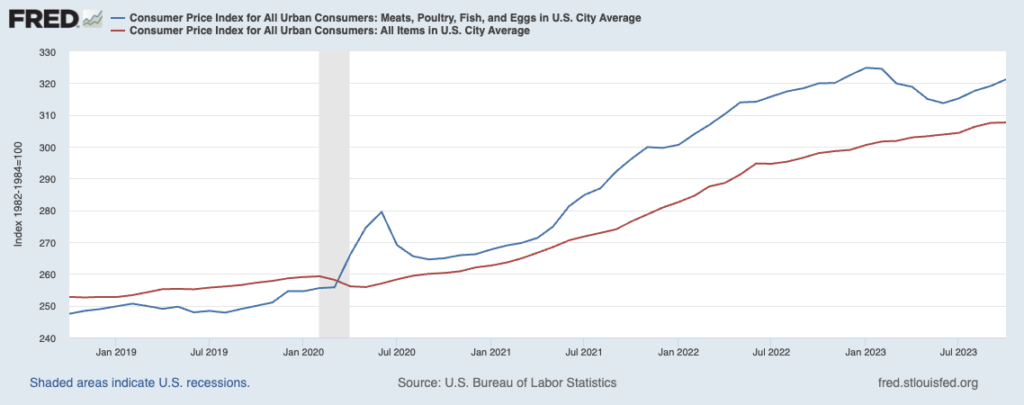
In its latest October 2023 CPI report, the BLS reported that the overall CPI index rose to 307.67 points, marking a 3.1% increase from a year earlier. The same index was at 252.88 five years ago, translating to a 21.7% surge over that period.
Had grocery products seen a slower increase than the overall inflation rate? Once again, the answer was negative.
A consumer basket comprising meat, poultry, fish and eggs was now a staggering 29.8% more expensive than it was in 2018.
As Thanksgiving approached, many Americans were finding that the feast was not only a time for gratitude but also for tighter budgeting as they grappled with rising food costs.
Chart: Overall CPI vs. CPI For Meats, Poultry, Fish And Eggs (Last 5 Years)

Now Read: Microsoft Surges To Record Highs, Stock Price Now At 33x Earnings: How Much Further Can It Climb?
Photo: Shutterstock
© 2025 Benzinga.com. Benzinga does not provide investment advice. All rights reserved.
Trade confidently with insights and alerts from analyst ratings, free reports and breaking news that affects the stocks you care about.