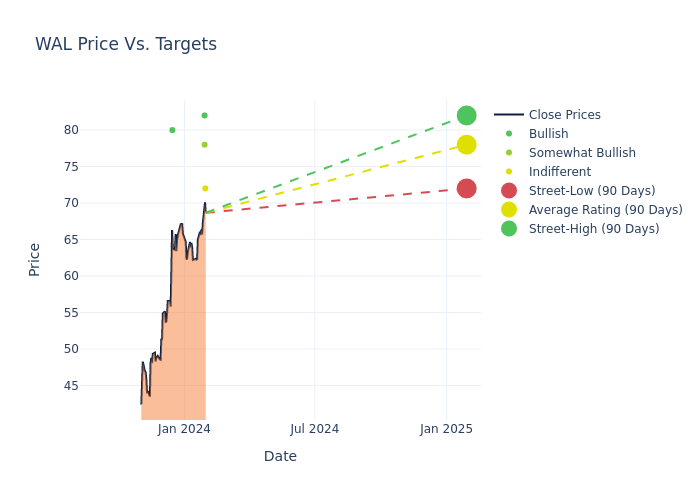
During the last three months, 5 analysts shared their evaluations of Western Alliance WAL, revealing diverse outlooks from bullish to bearish.
The following table provides a quick overview of their recent ratings, highlighting the changing sentiments over the past 30 days and comparing them to the preceding months.
| Bullish | Somewhat Bullish | Indifferent | Somewhat Bearish | Bearish | |
|---|---|---|---|---|---|
| Total Ratings | 3 | 1 | 1 | 0 | 0 |
| Last 30D | 0 | 0 | 1 | 0 | 0 |
| 1M Ago | 1 | 1 | 0 | 0 | 0 |
| 2M Ago | 2 | 0 | 0 | 0 | 0 |
| 3M Ago | 0 | 0 | 0 | 0 | 0 |
Analysts have recently evaluated Western Alliance and provided 12-month price targets. The average target is $74.6, accompanied by a high estimate of $82.00 and a low estimate of $61.00. This upward trend is apparent, with the current average reflecting a 9.71% increase from the previous average price target of $68.00.

Diving into Analyst Ratings: An In-Depth Exploration
A comprehensive examination of how financial experts perceive Western Alliance is derived from recent analyst actions. The following is a detailed summary of key analysts, their recent evaluations, and adjustments to ratings and price targets.
| Analyst | Analyst Firm | Action Taken | Rating | Current Price Target | Prior Price Target |
|---|---|---|---|---|---|
| Jared Shaw | Wells Fargo | Raises | Equal-Weight | $72.00 | $62.00 |
| Ben Gerlinger | Citigroup | Raises | Buy | $82.00 | $76.00 |
| Jon Arfstrom | RBC Capital | Raises | Outperform | $78.00 | $74.00 |
| Brandon King | Truist Securities | Raises | Buy | $80.00 | $60.00 |
| Ben Gerlinger | Citigroup | Announces | Buy | $61.00 | - |
Key Insights:
- Action Taken: Analysts frequently update their recommendations based on evolving market conditions and company performance. Whether they 'Maintain', 'Raise' or 'Lower' their stance, it reflects their reaction to recent developments related to Western Alliance. This information provides a snapshot of how analysts perceive the current state of the company.
- Rating: Offering a comprehensive view, analysts assess stocks qualitatively, spanning from 'Outperform' to 'Underperform'. These ratings convey expectations for the relative performance of Western Alliance compared to the broader market.
- Price Targets: Analysts explore the dynamics of price targets, providing estimates for the future value of Western Alliance's stock. This examination reveals shifts in analysts' expectations over time.
Capture valuable insights into Western Alliance's market standing by understanding these analyst evaluations alongside pertinent financial indicators. Stay informed and make strategic decisions with our Ratings Table.
Stay up to date on Western Alliance analyst ratings.
Discovering Western Alliance: A Closer Look
Western Alliance Bancorporation is a Las Vegas-based holding company with regional banks operating in Nevada, Arizona, and California. The bank offers retail banking services and focuses on mortgages for retail customers and commercial loans, mainly for real estate. The bank also has an investment advisory business that manages investment portfolios for Western clients and clients of other banks.
Breaking Down Western Alliance's Financial Performance
Market Capitalization Analysis: Below industry benchmarks, the company's market capitalization reflects a smaller scale relative to peers. This could be attributed to factors such as growth expectations or operational capacity.
Revenue Growth: Western Alliance's revenue growth over a period of 3 months has faced challenges. As of 31 December, 2023, the company experienced a revenue decline of approximately -7.17%. This indicates a decrease in the company's top-line earnings. In comparison to its industry peers, the company trails behind with a growth rate lower than the average among peers in the Financials sector.
Net Margin: The company's net margin is a standout performer, exceeding industry averages. With an impressive net margin of 26.85%, the company showcases strong profitability and effective cost control.
Return on Equity (ROE): Western Alliance's financial strength is reflected in its exceptional ROE, which exceeds industry averages. With a remarkable ROE of 2.58%, the company showcases efficient use of equity capital and strong financial health.
Return on Assets (ROA): Western Alliance's ROA excels beyond industry benchmarks, reaching 0.2%. This signifies efficient management of assets and strong financial health.
Debt Management: Western Alliance's debt-to-equity ratio is notably higher than the industry average. With a ratio of 1.44, the company relies more heavily on borrowed funds, indicating a higher level of financial risk.
Analyst Ratings: Simplified
Benzinga tracks 150 analyst firms and reports on their stock expectations. Analysts typically arrive at their conclusions by predicting how much money a company will make in the future, usually the upcoming five years, and how risky or predictable that company's revenue streams are.
Analysts attend company conference calls and meetings, research company financial statements, and communicate with insiders to publish their ratings on stocks. Analysts typically rate each stock once per quarter or whenever the company has a major update.
Some analysts also offer predictions for helpful metrics such as earnings, revenue, and growth estimates to provide further guidance as to what to do with certain tickers. It is important to keep in mind that while stock and sector analysts are specialists, they are also human and can only forecast their beliefs to traders.
This article was generated by Benzinga's automated content engine and reviewed by an editor.
Edge Rankings
Price Trend
© 2025 Benzinga.com. Benzinga does not provide investment advice. All rights reserved.
date | ticker | name | Price Target | Upside/Downside | Recommendation | Firm |
|---|
Trade confidently with insights and alerts from analyst ratings, free reports and breaking news that affects the stocks you care about.