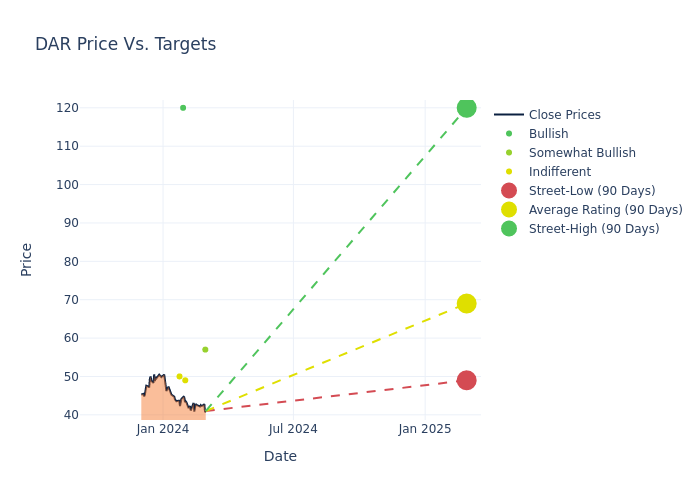
In the last three months, 5 analysts have published ratings on Darling Ingredients DAR, offering a diverse range of perspectives from bullish to bearish.
The table below summarizes their recent ratings, showcasing the evolving sentiments within the past 30 days and comparing them to the preceding months.
| Bullish | Somewhat Bullish | Indifferent | Somewhat Bearish | Bearish | |
|---|---|---|---|---|---|
| Total Ratings | 1 | 2 | 2 | 0 | 0 |
| Last 30D | 0 | 1 | 0 | 0 | 0 |
| 1M Ago | 0 | 0 | 1 | 0 | 0 |
| 2M Ago | 1 | 1 | 1 | 0 | 0 |
| 3M Ago | 0 | 0 | 0 | 0 | 0 |
The 12-month price targets, analyzed by analysts, offer insights with an average target of $67.2, a high estimate of $120.00, and a low estimate of $49.00. This current average has decreased by 11.29% from the previous average price target of $75.75.

Analyzing Analyst Ratings: A Detailed Breakdown
The standing of Darling Ingredients among financial experts is revealed through an in-depth exploration of recent analyst actions. The summary below outlines key analysts, their recent evaluations, and adjustments to ratings and price targets.
| Analyst | Analyst Firm | Action Taken | Rating | Current Price Target | Prior Price Target |
|---|---|---|---|---|---|
| Andrew Strelzik | BMO Capital | Lowers | Outperform | $57.00 | $60.00 |
| Thomas Palmer | Citigroup | Announces | Neutral | $49.00 | - |
| Derrick Whitfield | Stifel | Lowers | Buy | $120.00 | $123.00 |
| Andrew Strelzik | BMO Capital | Lowers | Outperform | $60.00 | $65.00 |
| Ben Bienvenu | Stephens & Co. | Lowers | Equal-Weight | $50.00 | $55.00 |
Key Insights:
- Action Taken: Responding to changing market dynamics and company performance, analysts update their recommendations. Whether they 'Maintain', 'Raise', or 'Lower' their stance, it signifies their response to recent developments related to Darling Ingredients. This offers insight into analysts' perspectives on the current state of the company.
- Rating: Analyzing trends, analysts offer qualitative evaluations, ranging from 'Outperform' to 'Underperform'. These ratings convey expectations for the relative performance of Darling Ingredients compared to the broader market.
- Price Targets: Analysts provide insights into price targets, offering estimates for the future value of Darling Ingredients's stock. This comparison reveals trends in analysts' expectations over time.
Analyzing these analyst evaluations alongside relevant financial metrics can provide a comprehensive view of Darling Ingredients's market position. Stay informed and make data-driven decisions with the assistance of our Ratings Table.
Stay up to date on Darling Ingredients analyst ratings.
Discovering Darling Ingredients: A Closer Look
Darling Ingredients Inc develops and manufactures sustainable ingredients for customers in the pharmaceutical, food, pet food, fuel, and fertilizer industries. It collects and transforms all aspects of animal by-product streams into ingredients, including gelatin, fats, proteins, pet food ingredients, fertilizers, and other specialty products. Also, the company recovers and converts used cooking oil and bakery remnants into feed and fuel ingredients. Darling has three primary business segments: feed ingredients (the majority of revenue), food ingredients, and fuel ingredients. It provides grease trap services for food businesses and sells various equipment for collecting and delivering cooking oil. The company derives the majority of its revenue from customers in North America.
Darling Ingredients: A Financial Overview
Market Capitalization Analysis: Above industry benchmarks, the company's market capitalization emphasizes a noteworthy size, indicative of a strong market presence.
Negative Revenue Trend: Examining Darling Ingredients's financials over 3 months reveals challenges. As of 30 September, 2023, the company experienced a decline of approximately -7.0% in revenue growth, reflecting a decrease in top-line earnings. As compared to its peers, the revenue growth lags behind its industry peers. The company achieved a growth rate lower than the average among peers in Consumer Staples sector.
Net Margin: Darling Ingredients's net margin is impressive, surpassing industry averages. With a net margin of 7.69%, the company demonstrates strong profitability and effective cost management.
Return on Equity (ROE): Darling Ingredients's ROE stands out, surpassing industry averages. With an impressive ROE of 2.86%, the company demonstrates effective use of equity capital and strong financial performance.
Return on Assets (ROA): Darling Ingredients's ROA surpasses industry standards, highlighting the company's exceptional financial performance. With an impressive 1.15% ROA, the company effectively utilizes its assets for optimal returns.
Debt Management: The company faces challenges in debt management with a debt-to-equity ratio higher than the industry average. With a ratio of 1.05, caution is advised due to increased financial risk.
How Are Analyst Ratings Determined?
Ratings come from analysts, or specialists within banking and financial systems that report for specific stocks or defined sectors (typically once per quarter for each stock). Analysts usually derive their information from company conference calls and meetings, financial statements, and conversations with important insiders to reach their decisions.
Some analysts publish their predictions for metrics such as growth estimates, earnings, and revenue to provide additional guidance with their ratings. When using analyst ratings, it is important to keep in mind that stock and sector analysts are also human and are only offering their opinions to investors.
This article was generated by Benzinga's automated content engine and reviewed by an editor.
© 2025 Benzinga.com. Benzinga does not provide investment advice. All rights reserved.
date | ticker | name | Price Target | Upside/Downside | Recommendation | Firm |
|---|
Trade confidently with insights and alerts from analyst ratings, free reports and breaking news that affects the stocks you care about.