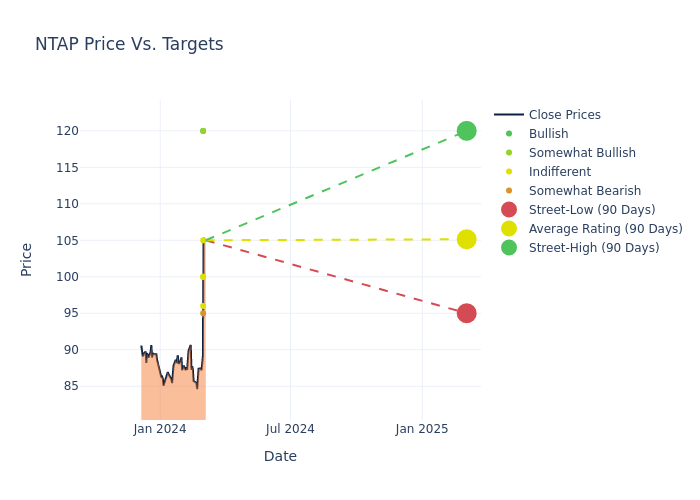
Throughout the last three months, 8 analysts have evaluated NetApp NTAP, offering a diverse set of opinions from bullish to bearish.
The following table encapsulates their recent ratings, offering a glimpse into the evolving sentiments over the past 30 days and comparing them to the preceding months.
| Bullish | Somewhat Bullish | Indifferent | Somewhat Bearish | Bearish | |
|---|---|---|---|---|---|
| Total Ratings | 1 | 1 | 4 | 2 | 0 |
| Last 30D | 0 | 0 | 0 | 0 | 0 |
| 1M Ago | 1 | 1 | 4 | 1 | 0 |
| 2M Ago | 0 | 0 | 0 | 1 | 0 |
| 3M Ago | 0 | 0 | 0 | 0 | 0 |
Analysts' evaluations of 12-month price targets offer additional insights, showcasing an average target of $102.88, with a high estimate of $120.00 and a low estimate of $87.00. This current average has increased by 11.66% from the previous average price target of $92.14.

Interpreting Analyst Ratings: A Closer Look
The analysis of recent analyst actions sheds light on the perception of NetApp by financial experts. The following summary presents key analysts, their recent evaluations, and adjustments to ratings and price targets.
| Analyst | Analyst Firm | Action Taken | Rating | Current Price Target | Prior Price Target |
|---|---|---|---|---|---|
| David Vogt | UBS | Raises | Neutral | $96.00 | $93.00 |
| Samik Chatterjee | JP Morgan | Raises | Underweight | $95.00 | $87.00 |
| Matthew Sheerin | Stifel | Raises | Buy | $120.00 | $105.00 |
| Matt Bryson | Wedbush | Raises | Neutral | $100.00 | $85.00 |
| Krish Sankar | TD Cowen | Raises | Outperform | $120.00 | $100.00 |
| Amit Daryanani | Evercore ISI Group | Raises | In-Line | $105.00 | $95.00 |
| Tim Long | Barclays | Raises | Equal-Weight | $100.00 | $80.00 |
| Samik Chatterjee | JP Morgan | Announces | Underweight | $87.00 | - |
Key Insights:
- Action Taken: Analysts respond to changes in market conditions and company performance, frequently updating their recommendations. Whether they 'Maintain', 'Raise' or 'Lower' their stance, it reflects their reaction to recent developments related to NetApp. This information offers a snapshot of how analysts perceive the current state of the company.
- Rating: Delving into assessments, analysts assign qualitative values, from 'Outperform' to 'Underperform'. These ratings communicate expectations for the relative performance of NetApp compared to the broader market.
- Price Targets: Delving into movements, analysts provide estimates for the future value of NetApp's stock. This analysis reveals shifts in analysts' expectations over time.
Capture valuable insights into NetApp's market standing by understanding these analyst evaluations alongside pertinent financial indicators. Stay informed and make strategic decisions with our Ratings Table.
Stay up to date on NetApp analyst ratings.
About NetApp
NetApp Inc is a leading provider of enterprise data management and storage solutions. The company's segments include Hybrid Cloud and Public Cloud. It generates maximum revenue from the Hybrid Cloud segment. The Hybrid Cloud segment offers a portfolio of storage management and infrastructure solutions that help customers recast their traditional data centers with the power of cloud. This portfolio is designed to operate with public clouds to unlock the potential of hybrid, multi-cloud operations. Hybrid Cloud is composed of software, hardware, and related support, as well as professional and other services.
NetApp: Financial Performance Dissected
Market Capitalization Analysis: Falling below industry benchmarks, the company's market capitalization reflects a reduced size compared to peers. This positioning may be influenced by factors such as growth expectations or operational capacity.
Revenue Growth: NetApp's revenue growth over a period of 3 months has been noteworthy. As of 31 January, 2024, the company achieved a revenue growth rate of approximately 5.24%. This indicates a substantial increase in the company's top-line earnings. When compared to others in the Information Technology sector, the company faces challenges, achieving a growth rate lower than the average among peers.
Net Margin: The company's net margin is a standout performer, exceeding industry averages. With an impressive net margin of 19.49%, the company showcases strong profitability and effective cost control.
Return on Equity (ROE): The company's ROE is a standout performer, exceeding industry averages. With an impressive ROE of 35.49%, the company showcases effective utilization of equity capital.
Return on Assets (ROA): The company's ROA is a standout performer, exceeding industry averages. With an impressive ROA of 3.39%, the company showcases effective utilization of assets.
Debt Management: NetApp's debt-to-equity ratio is notably higher than the industry average. With a ratio of 2.67, the company relies more heavily on borrowed funds, indicating a higher level of financial risk.
The Core of Analyst Ratings: What Every Investor Should Know
Experts in banking and financial systems, analysts specialize in reporting for specific stocks or defined sectors. Their comprehensive research involves attending company conference calls and meetings, analyzing financial statements, and engaging with insiders to generate what are known as analyst ratings for stocks. Typically, analysts assess and rate each stock once per quarter.
Beyond their standard evaluations, some analysts contribute predictions for metrics like growth estimates, earnings, and revenue, furnishing investors with additional guidance. Users of analyst ratings should be mindful that this specialized advice is shaped by human perspectives and may be subject to variability.
This article was generated by Benzinga's automated content engine and reviewed by an editor.
Edge Rankings
Price Trend
© 2025 Benzinga.com. Benzinga does not provide investment advice. All rights reserved.
date | ticker | name | Price Target | Upside/Downside | Recommendation | Firm |
|---|
Trade confidently with insights and alerts from analyst ratings, free reports and breaking news that affects the stocks you care about.