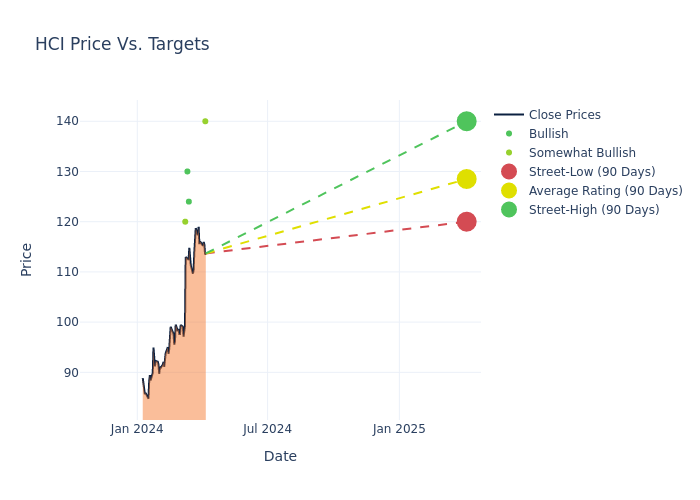
Across the recent three months, 6 analysts have shared their insights on HCI Group HCI, expressing a variety of opinions spanning from bullish to bearish.
The table below provides a snapshot of their recent ratings, showcasing how sentiments have evolved over the past 30 days and comparing them to the preceding months.
| Bullish | Somewhat Bullish | Indifferent | Somewhat Bearish | Bearish | |
|---|---|---|---|---|---|
| Total Ratings | 3 | 3 | 0 | 0 | 0 |
| Last 30D | 0 | 1 | 0 | 0 | 0 |
| 1M Ago | 2 | 2 | 0 | 0 | 0 |
| 2M Ago | 0 | 0 | 0 | 0 | 0 |
| 3M Ago | 1 | 0 | 0 | 0 | 0 |
Analysts have set 12-month price targets for HCI Group, revealing an average target of $127.67, a high estimate of $140.00, and a low estimate of $112.00. Surpassing the previous average price target of $109.60, the current average has increased by 16.49%.

Breaking Down Analyst Ratings: A Detailed Examination
The analysis of recent analyst actions sheds light on the perception of HCI Group by financial experts. The following summary presents key analysts, their recent evaluations, and adjustments to ratings and price targets.
| Analyst | Analyst Firm | Action Taken | Rating | Current Price Target | Prior Price Target |
|---|---|---|---|---|---|
| Michael Phillips | Oppenheimer | Maintains | Outperform | $140.00 | $140.00 |
| Michael Phillips | Oppenheimer | Maintains | Outperform | $140.00 | - |
| Casey Alexander | Compass Point | Raises | Buy | $124.00 | $90.00 |
| Mark Hughes | Truist Securities | Raises | Buy | $130.00 | $112.00 |
| Matthew Carletti | JMP Securities | Raises | Outperform | $120.00 | $110.00 |
| Mark Hughes | Truist Securities | Raises | Buy | $112.00 | $96.00 |
Key Insights:
- Action Taken: Analysts respond to changes in market conditions and company performance, frequently updating their recommendations. Whether they 'Maintain', 'Raise' or 'Lower' their stance, it reflects their reaction to recent developments related to HCI Group. This information offers a snapshot of how analysts perceive the current state of the company.
- Rating: Unveiling insights, analysts deliver qualitative insights into stock performance, from 'Outperform' to 'Underperform'. These ratings convey expectations for the relative performance of HCI Group compared to the broader market.
- Price Targets: Analysts explore the dynamics of price targets, providing estimates for the future value of HCI Group's stock. This examination reveals shifts in analysts' expectations over time.
Understanding these analyst evaluations alongside key financial indicators can offer valuable insights into HCI Group's market standing. Stay informed and make well-considered decisions with our Ratings Table.
Stay up to date on HCI Group analyst ratings.
If you are interested in following small-cap stock news and performance you can start by tracking it here.
Discovering HCI Group: A Closer Look
HCI Group Inc is engaged in the property and casualty insurance business through two Florida domiciled insurance companies, Homeowners Choice Property & Casualty Insurance Company (HCPCI) and TypTap Insurance Company (TypTap). Both HCPCI and TypTap are authorized to underwrite various homeowners' property and casualty insurance products and allied lines business in the state of Florida and other states. The operating segments of the group are HCPCI insurance operations, TypTap Group, Real estate operations, and Corporate and other. It derives key revenue from the HCPCI Insurance operation segment.
HCI Group: Financial Performance Dissected
Market Capitalization: Indicating a reduced size compared to industry averages, the company's market capitalization poses unique challenges.
Revenue Growth: Over the 3 months period, HCI Group showcased positive performance, achieving a revenue growth rate of 40.31% as of 31 December, 2023. This reflects a substantial increase in the company's top-line earnings. In comparison to its industry peers, the company stands out with a growth rate higher than the average among peers in the Financials sector.
Net Margin: HCI Group's net margin is impressive, surpassing industry averages. With a net margin of 22.66%, the company demonstrates strong profitability and effective cost management.
Return on Equity (ROE): HCI Group's ROE surpasses industry standards, highlighting the company's exceptional financial performance. With an impressive 14.05% ROE, the company effectively utilizes shareholder equity capital.
Return on Assets (ROA): HCI Group's ROA surpasses industry standards, highlighting the company's exceptional financial performance. With an impressive 2.09% ROA, the company effectively utilizes its assets for optimal returns.
Debt Management: HCI Group's debt-to-equity ratio surpasses industry norms, standing at 0.65. This suggests the company carries a substantial amount of debt, posing potential financial challenges.
Understanding the Relevance of Analyst Ratings
Ratings come from analysts, or specialists within banking and financial systems that report for specific stocks or defined sectors (typically once per quarter for each stock). Analysts usually derive their information from company conference calls and meetings, financial statements, and conversations with important insiders to reach their decisions.
Some analysts also offer predictions for helpful metrics such as earnings, revenue, and growth estimates to provide further guidance as to what to do with certain tickers. It is important to keep in mind that while stock and sector analysts are specialists, they are also human and can only forecast their beliefs to traders.
This article was generated by Benzinga's automated content engine and reviewed by an editor.
Edge Rankings
Price Trend
© 2025 Benzinga.com. Benzinga does not provide investment advice. All rights reserved.
date | ticker | name | Price Target | Upside/Downside | Recommendation | Firm |
|---|
Trade confidently with insights and alerts from analyst ratings, free reports and breaking news that affects the stocks you care about.