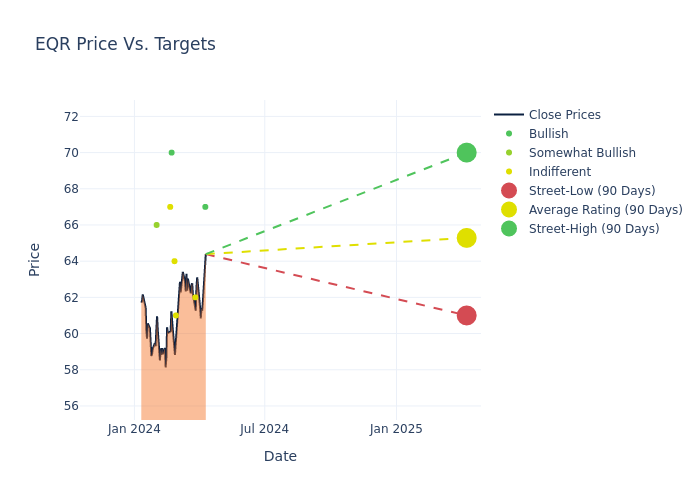
Analysts' ratings for Equity Residential EQR over the last quarter vary from bullish to bearish, as provided by 7 analysts.
The following table summarizes their recent ratings, shedding light on the changing sentiments within the past 30 days and comparing them to the preceding months.
| Bullish | Somewhat Bullish | Indifferent | Somewhat Bearish | Bearish | |
|---|---|---|---|---|---|
| Total Ratings | 2 | 1 | 4 | 0 | 0 |
| Last 30D | 1 | 0 | 0 | 0 | 0 |
| 1M Ago | 0 | 0 | 1 | 0 | 0 |
| 2M Ago | 1 | 0 | 3 | 0 | 0 |
| 3M Ago | 0 | 1 | 0 | 0 | 0 |
Analysts have recently evaluated Equity Residential and provided 12-month price targets. The average target is $65.29, accompanied by a high estimate of $70.00 and a low estimate of $61.00. This current average reflects an increase of 0.45% from the previous average price target of $65.00.

Exploring Analyst Ratings: An In-Depth Overview
The analysis of recent analyst actions sheds light on the perception of Equity Residential by financial experts. The following summary presents key analysts, their recent evaluations, and adjustments to ratings and price targets.
| Analyst | Analyst Firm | Action Taken | Rating | Current Price Target | Prior Price Target |
|---|---|---|---|---|---|
| Michael Lewis | Truist Securities | Lowers | Buy | $67.00 | $71.00 |
| Alexander Goldfarb | Piper Sandler | Maintains | Neutral | $62.00 | - |
| Vikram Malhorta | Mizuho | Lowers | Neutral | $61.00 | $62.00 |
| Adam Kramer | Morgan Stanley | Raises | Equal-Weight | $64.00 | $58.00 |
| Chandni Luthra | Goldman Sachs | Announces | Buy | $70.00 | - |
| Anthony Powell | Barclays | Lowers | Equal-Weight | $67.00 | $69.00 |
| Brad Heffern | RBC Capital | Raises | Outperform | $66.00 | $65.00 |
Key Insights:
- Action Taken: Analysts respond to changes in market conditions and company performance, frequently updating their recommendations. Whether they 'Maintain', 'Raise' or 'Lower' their stance, it reflects their reaction to recent developments related to Equity Residential. This information offers a snapshot of how analysts perceive the current state of the company.
- Rating: Offering insights into predictions, analysts assign qualitative values, from 'Outperform' to 'Underperform'. These ratings convey expectations for the relative performance of Equity Residential compared to the broader market.
- Price Targets: Analysts predict movements in price targets, offering estimates for Equity Residential's future value. Examining the current and prior targets offers insights into analysts' evolving expectations.
Navigating through these analyst evaluations alongside other financial indicators can contribute to a holistic understanding of Equity Residential's market standing. Stay informed and make data-driven decisions with our Ratings Table.
Stay up to date on Equity Residential analyst ratings.
About Equity Residential
Equity Residential owns a portfolio of 302 apartment communities with around 80,000 units and is developing two additional properties with 537 units. The company focuses on owning large, high-quality properties in the urban and suburban submarkets of Southern California, San Francisco, Washington, D.C., New York, Seattle, and Boston.
Key Indicators: Equity Residential's Financial Health
Market Capitalization Analysis: The company's market capitalization is above the industry average, indicating that it is relatively larger in size compared to peers. This may suggest a higher level of investor confidence and market recognition.
Positive Revenue Trend: Examining Equity Residential's financials over 3 months reveals a positive narrative. The company achieved a noteworthy revenue growth rate of 3.97% as of 31 December, 2023, showcasing a substantial increase in top-line earnings. As compared to competitors, the company surpassed expectations with a growth rate higher than the average among peers in the Real Estate sector.
Net Margin: Equity Residential's financial strength is reflected in its exceptional net margin, which exceeds industry averages. With a remarkable net margin of 42.74%, the company showcases strong profitability and effective cost management.
Return on Equity (ROE): Equity Residential's financial strength is reflected in its exceptional ROE, which exceeds industry averages. With a remarkable ROE of 2.82%, the company showcases efficient use of equity capital and strong financial health.
Return on Assets (ROA): Equity Residential's ROA surpasses industry standards, highlighting the company's exceptional financial performance. With an impressive 1.55% ROA, the company effectively utilizes its assets for optimal returns.
Debt Management: Equity Residential's debt-to-equity ratio is below the industry average. With a ratio of 0.7, the company relies less on debt financing, maintaining a healthier balance between debt and equity, which can be viewed positively by investors.
How Are Analyst Ratings Determined?
Benzinga tracks 150 analyst firms and reports on their stock expectations. Analysts typically arrive at their conclusions by predicting how much money a company will make in the future, usually the upcoming five years, and how risky or predictable that company's revenue streams are.
Analysts attend company conference calls and meetings, research company financial statements, and communicate with insiders to publish their ratings on stocks. Analysts typically rate each stock once per quarter or whenever the company has a major update.
Analysts may enhance their evaluations by incorporating forecasts for metrics like growth estimates, earnings, and revenue, delivering additional guidance to investors. It is vital to acknowledge that, although experts in stocks and sectors, analysts are human and express their opinions when providing insights.
This article was generated by Benzinga's automated content engine and reviewed by an editor.
Edge Rankings
Price Trend
© 2025 Benzinga.com. Benzinga does not provide investment advice. All rights reserved.
date | ticker | name | Price Target | Upside/Downside | Recommendation | Firm |
|---|
Trade confidently with insights and alerts from analyst ratings, free reports and breaking news that affects the stocks you care about.