
Analysts' ratings for Baker Hughes BKR over the last quarter vary from bullish to bearish, as provided by 5 analysts.
The following table provides a quick overview of their recent ratings, highlighting the changing sentiments over the past 30 days and comparing them to the preceding months.
| Bullish | Somewhat Bullish | Indifferent | Somewhat Bearish | Bearish | |
|---|---|---|---|---|---|
| Total Ratings | 2 | 3 | 0 | 0 | 0 |
| Last 30D | 1 | 0 | 0 | 0 | 0 |
| 1M Ago | 0 | 1 | 0 | 0 | 0 |
| 2M Ago | 0 | 0 | 0 | 0 | 0 |
| 3M Ago | 1 | 2 | 0 | 0 | 0 |
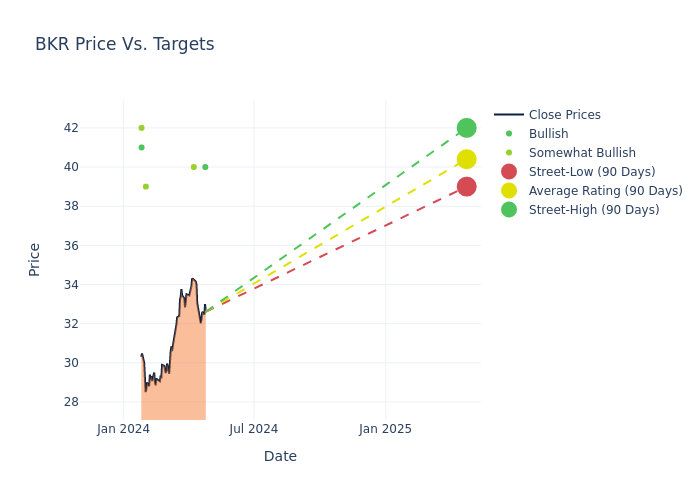
Analysts have set 12-month price targets for Baker Hughes, revealing an average target of $40.4, a high estimate of $42.00, and a low estimate of $39.00. Highlighting a 4.94% decrease, the current average has fallen from the previous average price target of $42.50.
Interpreting Analyst Ratings: A Closer Look
An in-depth analysis of recent analyst actions unveils how financial experts perceive Baker Hughes. The following summary outlines key analysts, their recent evaluations, and adjustments to ratings and price targets.
| Analyst | Analyst Firm | Action Taken | Rating | Current Price Target | Prior Price Target |
|---|---|---|---|---|---|
| Kurt Hallead | Benchmark | Maintains | Buy | $40.00 | - |
| Charles Minervino | Susquehanna | Maintains | Positive | $40.00 | - |
| Keith Mackey | RBC Capital | Maintains | Outperform | $39.00 | - |
| David Anderson | Barclays | Lowers | Overweight | $42.00 | $43.00 |
| Scott Gruber | Citigroup | Lowers | Buy | $41.00 | $42.00 |
Key Insights:
- Action Taken: Responding to changing market dynamics and company performance, analysts update their recommendations. Whether they 'Maintain', 'Raise', or 'Lower' their stance, it signifies their response to recent developments related to Baker Hughes. This offers insight into analysts' perspectives on the current state of the company.
- Rating: Offering a comprehensive view, analysts assess stocks qualitatively, spanning from 'Outperform' to 'Underperform'. These ratings convey expectations for the relative performance of Baker Hughes compared to the broader market.
- Price Targets: Analysts set price targets as an estimate of a stock's future value. Comparing the current and prior price targets provides insight into how analysts' expectations have changed over time. This information can be valuable for investors seeking to understand consensus views on the stock's potential future performance.
Capture valuable insights into Baker Hughes's market standing by understanding these analyst evaluations alongside pertinent financial indicators. Stay informed and make strategic decisions with our Ratings Table.
Stay up to date on Baker Hughes analyst ratings.
Unveiling the Story Behind Baker Hughes
Baker Hughes is a global leader in oilfield services and oilfield equipment, with particularly strong presences in the artificial lift, specialty chemicals, and completions markets. It maintains modest exposure to offshore oil and gas production. The other half of its business focuses on industrial power generation, process solutions, and industrial asset management, with high exposure to the liquid natural gas market specifically, as well as broader industrials end markets.
Breaking Down Baker Hughes's Financial Performance
Market Capitalization Analysis: With an elevated market capitalization, the company stands out above industry averages, showcasing substantial size and market acknowledgment.
Revenue Growth: Baker Hughes's revenue growth over a period of 3 months has been noteworthy. As of 31 December, 2023, the company achieved a revenue growth rate of approximately 15.75%. This indicates a substantial increase in the company's top-line earnings. As compared to competitors, the company surpassed expectations with a growth rate higher than the average among peers in the Energy sector.
Net Margin: Baker Hughes's net margin falls below industry averages, indicating challenges in achieving strong profitability. With a net margin of 6.44%, the company may face hurdles in effective cost management.
Return on Equity (ROE): The company's ROE is below industry benchmarks, signaling potential difficulties in efficiently using equity capital. With an ROE of 2.87%, the company may need to address challenges in generating satisfactory returns for shareholders.
Return on Assets (ROA): Baker Hughes's ROA lags behind industry averages, suggesting challenges in maximizing returns from its assets. With an ROA of 1.2%, the company may face hurdles in achieving optimal financial performance.
Debt Management: Baker Hughes's debt-to-equity ratio is below the industry average. With a ratio of 0.39, the company relies less on debt financing, maintaining a healthier balance between debt and equity, which can be viewed positively by investors.
Analyst Ratings: Simplified
Experts in banking and financial systems, analysts specialize in reporting for specific stocks or defined sectors. Their comprehensive research involves attending company conference calls and meetings, analyzing financial statements, and engaging with insiders to generate what are known as analyst ratings for stocks. Typically, analysts assess and rate each stock once per quarter.
Some analysts will also offer forecasts for metrics like growth estimates, earnings, and revenue to provide further guidance on stocks. Investors who use analyst ratings should note that this specialized advice comes from humans and may be subject to error.
This article was generated by Benzinga's automated content engine and reviewed by an editor.
Edge Rankings
Price Trend
© 2025 Benzinga.com. Benzinga does not provide investment advice. All rights reserved.
date | ticker | name | Price Target | Upside/Downside | Recommendation | Firm |
|---|
Trade confidently with insights and alerts from analyst ratings, free reports and breaking news that affects the stocks you care about.

