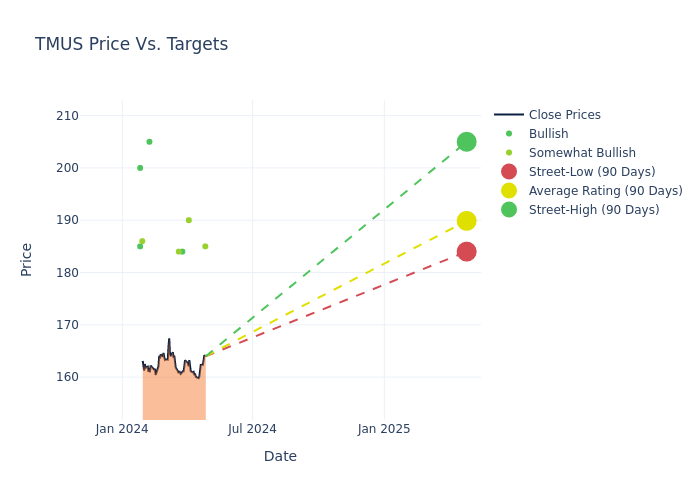
Analysts' ratings for T-Mobile US TMUS over the last quarter vary from bullish to bearish, as provided by 6 analysts.
The table below provides a snapshot of their recent ratings, showcasing how sentiments have evolved over the past 30 days and comparing them to the preceding months.
| Bullish | Somewhat Bullish | Indifferent | Somewhat Bearish | Bearish | |
|---|---|---|---|---|---|
| Total Ratings | 2 | 4 | 0 | 0 | 0 |
| Last 30D | 0 | 1 | 0 | 0 | 0 |
| 1M Ago | 0 | 1 | 0 | 0 | 0 |
| 2M Ago | 1 | 1 | 0 | 0 | 0 |
| 3M Ago | 1 | 1 | 0 | 0 | 0 |
Analysts have set 12-month price targets for T-Mobile US, revealing an average target of $189.0, a high estimate of $205.00, and a low estimate of $184.00. Surpassing the previous average price target of $185.00, the current average has increased by 2.16%.

Investigating Analyst Ratings: An Elaborate Study
The perception of T-Mobile US by financial experts is analyzed through recent analyst actions. The following summary presents key analysts, their recent evaluations, and adjustments to ratings and price targets.
| Analyst | Analyst Firm | Action Taken | Rating | Current Price Target | Prior Price Target |
|---|---|---|---|---|---|
| Brandon Nispel | Keybanc | Raises | Overweight | $185.00 | $175.00 |
| Timothy Horan | Oppenheimer | Maintains | Outperform | $190.00 | $190.00 |
| Michael Rollins | Citigroup | Raises | Buy | $184.00 | $176.00 |
| Jonathan Atkin | RBC Capital | Maintains | Outperform | $184.00 | - |
| Ivan Feinseth | Tigress Financial | Raises | Buy | $205.00 | $204.00 |
| Simon Flannery | Morgan Stanley | Raises | Overweight | $186.00 | $180.00 |
Key Insights:
- Action Taken: Responding to changing market dynamics and company performance, analysts update their recommendations. Whether they 'Maintain', 'Raise', or 'Lower' their stance, it signifies their response to recent developments related to T-Mobile US. This offers insight into analysts' perspectives on the current state of the company.
- Rating: Providing a comprehensive analysis, analysts offer qualitative assessments, ranging from 'Outperform' to 'Underperform'. These ratings reflect expectations for the relative performance of T-Mobile US compared to the broader market.
- Price Targets: Analysts provide insights into price targets, offering estimates for the future value of T-Mobile US's stock. This comparison reveals trends in analysts' expectations over time.
Assessing these analyst evaluations alongside crucial financial indicators can provide a comprehensive overview of T-Mobile US's market position. Stay informed and make well-judged decisions with the assistance of our Ratings Table.
Stay up to date on T-Mobile US analyst ratings.
Get to Know T-Mobile US Better
Deutsche Telekom merged its T-Mobile USA unit with prepaid specialist MetroPCS in 2013, and that firm merged with Sprint in 2020, creating the second-largest wireless carrier in the U.S. T-Mobile now serves 76 million postpaid and 22 million prepaid phone customers, equal to around 30% of the U.S. retail wireless market. The firm entered the fixed-wireless broadband market aggressively in 2021 and now serves nearly 5 million residential and business customers. In addition, T-Mobile provides wholesale services to resellers.
Financial Milestones: T-Mobile US's Journey
Market Capitalization Highlights: Above the industry average, the company's market capitalization signifies a significant scale, indicating strong confidence and market prominence.
Revenue Growth: T-Mobile US's revenue growth over a period of 3 months has been noteworthy. As of 31 December, 2023, the company achieved a revenue growth rate of approximately 1.01%. This indicates a substantial increase in the company's top-line earnings. As compared to competitors, the company encountered difficulties, with a growth rate lower than the average among peers in the Communication Services sector.
Net Margin: T-Mobile US's net margin surpasses industry standards, highlighting the company's exceptional financial performance. With an impressive 9.83% net margin, the company effectively manages costs and achieves strong profitability.
Return on Equity (ROE): T-Mobile US's ROE surpasses industry standards, highlighting the company's exceptional financial performance. With an impressive 3.11% ROE, the company effectively utilizes shareholder equity capital.
Return on Assets (ROA): T-Mobile US's ROA excels beyond industry benchmarks, reaching 0.97%. This signifies efficient management of assets and strong financial health.
Debt Management: The company maintains a balanced debt approach with a debt-to-equity ratio below industry norms, standing at 1.75.
The Core of Analyst Ratings: What Every Investor Should Know
Analyst ratings serve as essential indicators of stock performance, provided by experts in banking and financial systems. These specialists diligently analyze company financial statements, participate in conference calls, and engage with insiders to generate quarterly ratings for individual stocks.
In addition to their assessments, some analysts extend their insights by offering predictions for key metrics such as earnings, revenue, and growth estimates. This supplementary information provides further guidance for traders. It is crucial to recognize that, despite their specialization, analysts are human and can only provide forecasts based on their beliefs.
This article was generated by Benzinga's automated content engine and reviewed by an editor.
© 2025 Benzinga.com. Benzinga does not provide investment advice. All rights reserved.
date | ticker | name | Price Target | Upside/Downside | Recommendation | Firm |
|---|
Trade confidently with insights and alerts from analyst ratings, free reports and breaking news that affects the stocks you care about.