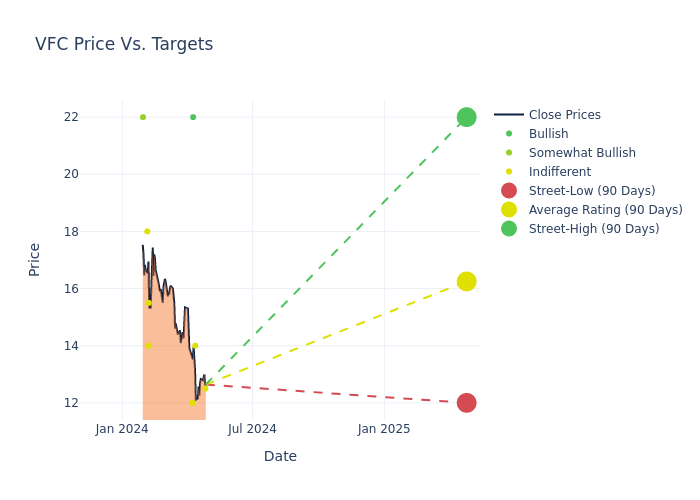
Analysts' ratings for VF VFC over the last quarter vary from bullish to bearish, as provided by 12 analysts.
In the table below, you'll find a summary of their recent ratings, revealing the shifting sentiments over the past 30 days and comparing them to the previous months.
| Bullish | Somewhat Bullish | Indifferent | Somewhat Bearish | Bearish | |
|---|---|---|---|---|---|
| Total Ratings | 2 | 1 | 9 | 0 | 0 |
| Last 30D | 0 | 0 | 1 | 0 | 0 |
| 1M Ago | 1 | 0 | 2 | 0 | 0 |
| 2M Ago | 0 | 0 | 0 | 0 | 0 |
| 3M Ago | 1 | 1 | 6 | 0 | 0 |
Analysts have recently evaluated VF and provided 12-month price targets. The average target is $16.38, accompanied by a high estimate of $22.00 and a low estimate of $12.00. A 9.25% drop is evident in the current average compared to the previous average price target of $18.05.

Deciphering Analyst Ratings: An In-Depth Analysis
In examining recent analyst actions, we gain insights into how financial experts perceive VF. The following summary outlines key analysts, their recent evaluations, and adjustments to ratings and price targets.
| Analyst | Analyst Firm | Action Taken | Rating | Current Price Target | Prior Price Target |
|---|---|---|---|---|---|
| Brooke Roach | Goldman Sachs | Lowers | Neutral | $12.50 | $14.00 |
| Laurent Vasilescu | Exane BNP Paribas | Lowers | Neutral | $14.00 | $18.00 |
| Jim Duffy | Stifel | Maintains | Buy | $22.00 | $22.00 |
| Matthew Boss | JP Morgan | Lowers | Neutral | $12.00 | $16.00 |
| Brooke Roach | Goldman Sachs | Lowers | Neutral | $14.00 | $19.00 |
| Jim Duffy | Stifel | Lowers | Buy | $22.00 | $24.00 |
| Ike Boruchow | Wells Fargo | Lowers | Equal-Weight | $14.00 | $17.00 |
| Brooke Roach | Goldman Sachs | Announces | Neutral | $14.00 | - |
| Tom Nikic | Wedbush | Lowers | Neutral | $15.50 | $16.50 |
| Jay Sole | UBS | Lowers | Neutral | $18.00 | $19.00 |
| Tom Nikic | Wedbush | Raises | Neutral | $16.50 | $15.00 |
| Dana Telsey | Telsey Advisory Group | Maintains | Outperform | $22.00 | - |
Key Insights:
- Action Taken: Responding to changing market dynamics and company performance, analysts update their recommendations. Whether they 'Maintain', 'Raise', or 'Lower' their stance, it signifies their response to recent developments related to VF. This offers insight into analysts' perspectives on the current state of the company.
- Rating: Providing a comprehensive analysis, analysts offer qualitative assessments, ranging from 'Outperform' to 'Underperform'. These ratings reflect expectations for the relative performance of VF compared to the broader market.
- Price Targets: Delving into movements, analysts provide estimates for the future value of VF's stock. This analysis reveals shifts in analysts' expectations over time.
Navigating through these analyst evaluations alongside other financial indicators can contribute to a holistic understanding of VF's market standing. Stay informed and make data-driven decisions with our Ratings Table.
Stay up to date on VF analyst ratings.
Get to Know VF Better
VF designs, produces, and distributes branded apparel, footwear, and accessories. Its apparel categories are active, outdoor, and work. Its portfolio of about a dozen brands includes Vans, The North Face, Timberland, Supreme, and Dickies. VF markets its products in the Americas, Europe, and Asia-Pacific through wholesale sales to retailers, e-commerce, and branded stores owned by the company and partners. The company has grown through multiple acquisitions and traces its roots to 1899.
Unraveling the Financial Story of VF
Market Capitalization Analysis: The company exhibits a lower market capitalization profile, positioning itself below industry averages. This suggests a smaller scale relative to peers.
Revenue Challenges: VF's revenue growth over 3 months faced difficulties. As of 31 December, 2023, the company experienced a decline of approximately -16.16%. This indicates a decrease in top-line earnings. In comparison to its industry peers, the company trails behind with a growth rate lower than the average among peers in the Consumer Discretionary sector.
Net Margin: VF's net margin lags behind industry averages, suggesting challenges in maintaining strong profitability. With a net margin of -1.43%, the company may face hurdles in effective cost management.
Return on Equity (ROE): VF's ROE is below industry averages, indicating potential challenges in efficiently utilizing equity capital. With an ROE of -1.97%, the company may face hurdles in achieving optimal financial returns.
Return on Assets (ROA): VF's ROA is below industry standards, pointing towards difficulties in efficiently utilizing assets. With an ROA of -0.33%, the company may encounter challenges in delivering satisfactory returns from its assets.
Debt Management: VF's debt-to-equity ratio stands notably higher than the industry average, reaching 3.48. This indicates a heavier reliance on borrowed funds, raising concerns about financial leverage.
Analyst Ratings: Simplified
Analyst ratings serve as essential indicators of stock performance, provided by experts in banking and financial systems. These specialists diligently analyze company financial statements, participate in conference calls, and engage with insiders to generate quarterly ratings for individual stocks.
Analysts may enhance their evaluations by incorporating forecasts for metrics like growth estimates, earnings, and revenue, delivering additional guidance to investors. It is vital to acknowledge that, although experts in stocks and sectors, analysts are human and express their opinions when providing insights.
This article was generated by Benzinga's automated content engine and reviewed by an editor.
© 2025 Benzinga.com. Benzinga does not provide investment advice. All rights reserved.
date | ticker | name | Price Target | Upside/Downside | Recommendation | Firm |
|---|
Trade confidently with insights and alerts from analyst ratings, free reports and breaking news that affects the stocks you care about.