
4 analysts have shared their evaluations of Hillman Solns HLMN during the recent three months, expressing a mix of bullish and bearish perspectives.
The following table provides a quick overview of their recent ratings, highlighting the changing sentiments over the past 30 days and comparing them to the preceding months.
| Bullish | Somewhat Bullish | Indifferent | Somewhat Bearish | Bearish | |
|---|---|---|---|---|---|
| Total Ratings | 2 | 1 | 1 | 0 | 0 |
| Last 30D | 1 | 1 | 0 | 0 | 0 |
| 1M Ago | 0 | 0 | 0 | 0 | 0 |
| 2M Ago | 0 | 0 | 1 | 0 | 0 |
| 3M Ago | 1 | 0 | 0 | 0 | 0 |
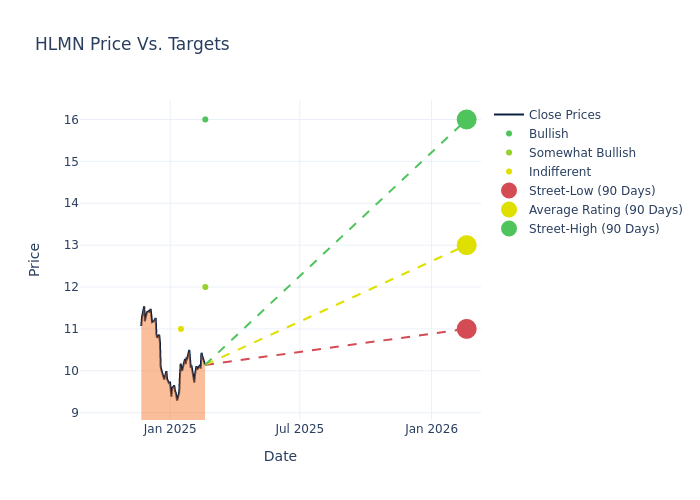
Providing deeper insights, analysts have established 12-month price targets, indicating an average target of $13.75, along with a high estimate of $16.00 and a low estimate of $11.00. This current average has not changed from the previous average price target.
Diving into Analyst Ratings: An In-Depth Exploration
In examining recent analyst actions, we gain insights into how financial experts perceive Hillman Solns. The following summary outlines key analysts, their recent evaluations, and adjustments to ratings and price targets.
| Analyst | Analyst Firm | Action Taken | Rating | Current Price Target | Prior Price Target |
|---|---|---|---|---|---|
| Reuben Garner | Benchmark | Maintains | Buy | $16.00 | $16.00 |
| David Manthey | Baird | Lowers | Outperform | $12.00 | $14.00 |
| Matthew Bouley | Barclays | Lowers | Equal-Weight | $11.00 | $12.00 |
| Reuben Garner | Benchmark | Raises | Buy | $16.00 | $13.00 |
Key Insights:
- Action Taken: Analysts frequently update their recommendations based on evolving market conditions and company performance. Whether they 'Maintain', 'Raise' or 'Lower' their stance, it reflects their reaction to recent developments related to Hillman Solns. This information provides a snapshot of how analysts perceive the current state of the company.
- Rating: Delving into assessments, analysts assign qualitative values, from 'Outperform' to 'Underperform'. These ratings communicate expectations for the relative performance of Hillman Solns compared to the broader market.
- Price Targets: Analysts set price targets as an estimate of a stock's future value. Comparing the current and prior price targets provides insight into how analysts' expectations have changed over time. This information can be valuable for investors seeking to understand consensus views on the stock's potential future performance.
Navigating through these analyst evaluations alongside other financial indicators can contribute to a holistic understanding of Hillman Solns's market standing. Stay informed and make data-driven decisions with our Ratings Table.
Stay up to date on Hillman Solns analyst ratings.
If you are interested in following small-cap stock news and performance you can start by tracking it here.
Get to Know Hillman Solns Better
Hillman Solutions Corp is a provider of hardware-related products and related merchandising services to retail markets in North America. The company sells its products to hardware stores, home centers, mass merchants, pet supply stores, and other retail outlets. Its product lines include thousands of small parts such as fasteners and related hardware items; threaded rod and metal shapes; keys and accessories; builder's hardware; personal protective equipment, such as gloves and eye-wear; and identification items, such as tags and letters, numbers, and signs. The segments of the group are Hardware and Protective Solutions, which is the key revenue-generating segment; Robotics and Digital Solutions; and Canada. It has a business presence in the US, Canada and Mexico.
Hillman Solns: A Financial Overview
Market Capitalization Analysis: Below industry benchmarks, the company's market capitalization reflects a smaller scale relative to peers. This could be attributed to factors such as growth expectations or operational capacity.
Revenue Challenges: Hillman Solns's revenue growth over 3 months faced difficulties. As of 30 September, 2024, the company experienced a decline of approximately -1.42%. This indicates a decrease in top-line earnings. When compared to others in the Industrials sector, the company faces challenges, achieving a growth rate lower than the average among peers.
Net Margin: Hillman Solns's financial strength is reflected in its exceptional net margin, which exceeds industry averages. With a remarkable net margin of 1.89%, the company showcases strong profitability and effective cost management.
Return on Equity (ROE): Hillman Solns's ROE surpasses industry standards, highlighting the company's exceptional financial performance. With an impressive 0.63% ROE, the company effectively utilizes shareholder equity capital.
Return on Assets (ROA): Hillman Solns's ROA excels beyond industry benchmarks, reaching 0.31%. This signifies efficient management of assets and strong financial health.
Debt Management: Hillman Solns's debt-to-equity ratio is notably higher than the industry average. With a ratio of 0.71, the company relies more heavily on borrowed funds, indicating a higher level of financial risk.
Understanding the Relevance of Analyst Ratings
Ratings come from analysts, or specialists within banking and financial systems that report for specific stocks or defined sectors (typically once per quarter for each stock). Analysts usually derive their information from company conference calls and meetings, financial statements, and conversations with important insiders to reach their decisions.
In addition to their assessments, some analysts extend their insights by offering predictions for key metrics such as earnings, revenue, and growth estimates. This supplementary information provides further guidance for traders. It is crucial to recognize that, despite their specialization, analysts are human and can only provide forecasts based on their beliefs.
Breaking: Wall Street's Next Big Mover
Benzinga's #1 analyst just identified a stock poised for explosive growth. This under-the-radar company could surge 200%+ as major market shifts unfold. Click here for urgent details.
This article was generated by Benzinga's automated content engine and reviewed by an editor.
Edge Rankings
Price Trend
© 2025 Benzinga.com. Benzinga does not provide investment advice. All rights reserved.
date | ticker | name | Price Target | Upside/Downside | Recommendation | Firm |
|---|
Trade confidently with insights and alerts from analyst ratings, free reports and breaking news that affects the stocks you care about.

