
12 analysts have shared their evaluations of Procter & Gamble PG during the recent three months, expressing a mix of bullish and bearish perspectives.
The following table encapsulates their recent ratings, offering a glimpse into the evolving sentiments over the past 30 days and comparing them to the preceding months.
| Bullish | Somewhat Bullish | Indifferent | Somewhat Bearish | Bearish | |
|---|---|---|---|---|---|
| Total Ratings | 3 | 3 | 6 | 0 | 0 |
| Last 30D | 0 | 0 | 1 | 0 | 0 |
| 1M Ago | 0 | 0 | 0 | 0 | 0 |
| 2M Ago | 3 | 3 | 5 | 0 | 0 |
| 3M Ago | 0 | 0 | 0 | 0 | 0 |
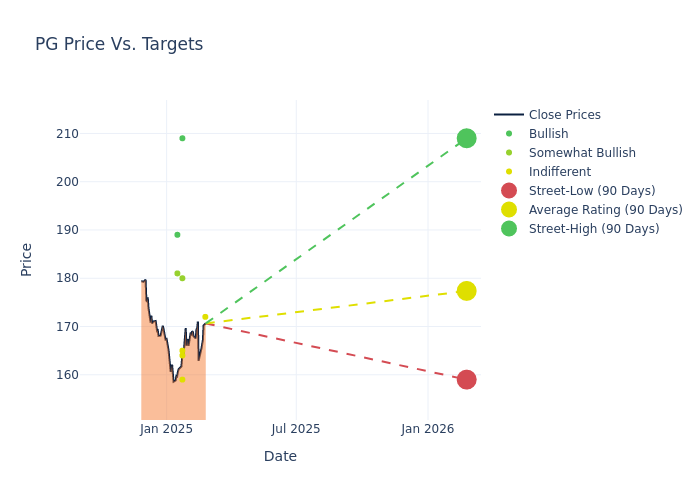
The 12-month price targets assessed by analysts reveal further insights, featuring an average target of $176.67, a high estimate of $209.00, and a low estimate of $155.00. A negative shift in sentiment is evident as analysts have decreased the average price target by 1.35%.
Interpreting Analyst Ratings: A Closer Look
An in-depth analysis of recent analyst actions unveils how financial experts perceive Procter & Gamble. The following summary outlines key analysts, their recent evaluations, and adjustments to ratings and price targets.
| Analyst | Analyst Firm | Action Taken | Rating | Current Price Target | Prior Price Target |
|---|---|---|---|---|---|
| Korinne Wolfmeyer | Piper Sandler | Lowers | Neutral | $172.00 | $173.00 |
| Nik Modi | RBC Capital | Maintains | Sector Perform | $164.00 | $164.00 |
| Mark Astrachan | Stifel | Raises | Hold | $165.00 | $161.00 |
| Chris Carey | Wells Fargo | Raises | Overweight | $180.00 | $176.00 |
| Lauren Lieberman | Barclays | Raises | Equal-Weight | $159.00 | $155.00 |
| Linda Bolton Weiser | DA Davidson | Maintains | Buy | $209.00 | $209.00 |
| Lauren Lieberman | Barclays | Lowers | Equal-Weight | $155.00 | $163.00 |
| Mark Astrachan | Stifel | Lowers | Hold | $161.00 | $167.00 |
| Peter Grom | UBS | Lowers | Buy | $189.00 | $196.00 |
| Andrea Teixeira | JP Morgan | Lowers | Overweight | $181.00 | $186.00 |
| Chris Carey | Wells Fargo | Lowers | Overweight | $176.00 | $190.00 |
| Linda Bolton Weiser | DA Davidson | Maintains | Buy | $209.00 | $209.00 |
Key Insights:
- Action Taken: Responding to changing market dynamics and company performance, analysts update their recommendations. Whether they 'Maintain', 'Raise', or 'Lower' their stance, it signifies their response to recent developments related to Procter & Gamble. This offers insight into analysts' perspectives on the current state of the company.
- Rating: Analysts unravel qualitative evaluations for stocks, ranging from 'Outperform' to 'Underperform'. These ratings offer insights into expectations for the relative performance of Procter & Gamble compared to the broader market.
- Price Targets: Understanding forecasts, analysts offer estimates for Procter & Gamble's future value. Examining the current and prior targets provides insight into analysts' changing expectations.
Analyzing these analyst evaluations alongside relevant financial metrics can provide a comprehensive view of Procter & Gamble's market position. Stay informed and make data-driven decisions with the assistance of our Ratings Table.
Stay up to date on Procter & Gamble analyst ratings.
Discovering Procter & Gamble: A Closer Look
Since its founding in 1837, Procter & Gamble has become one of the world's largest consumer product manufacturers, with annual sales approaching $85 billion. It operates with a lineup of leading brands, including more than 20 that generate north of $1 billion each in annual global sales, such as Tide laundry detergent, Charmin toilet paper, Pantene shampoo, and Pampers diapers. Sales outside its home turf represent more than half of the firm's consolidated total.
Procter & Gamble's Financial Performance
Market Capitalization: Surpassing industry standards, the company's market capitalization asserts its dominance in terms of size, suggesting a robust market position.
Revenue Growth: Over the 3 months period, Procter & Gamble showcased positive performance, achieving a revenue growth rate of 2.06% as of 31 December, 2024. This reflects a substantial increase in the company's top-line earnings. When compared to others in the Consumer Staples sector, the company faces challenges, achieving a growth rate lower than the average among peers.
Net Margin: Procter & Gamble's financial strength is reflected in its exceptional net margin, which exceeds industry averages. With a remarkable net margin of 20.83%, the company showcases strong profitability and effective cost management.
Return on Equity (ROE): Procter & Gamble's ROE is below industry averages, indicating potential challenges in efficiently utilizing equity capital. With an ROE of 8.99%, the company may face hurdles in achieving optimal financial returns.
Return on Assets (ROA): Procter & Gamble's ROA stands out, surpassing industry averages. With an impressive ROA of 3.66%, the company demonstrates effective utilization of assets and strong financial performance.
Debt Management: Procter & Gamble's debt-to-equity ratio is below the industry average. With a ratio of 0.69, the company relies less on debt financing, maintaining a healthier balance between debt and equity, which can be viewed positively by investors.
How Are Analyst Ratings Determined?
Within the domain of banking and financial systems, analysts specialize in reporting for specific stocks or defined sectors. Their work involves attending company conference calls and meetings, researching company financial statements, and communicating with insiders to publish "analyst ratings" for stocks. Analysts typically assess and rate each stock once per quarter.
Analysts may supplement their ratings with predictions for metrics like growth estimates, earnings, and revenue, offering investors a more comprehensive outlook. However, investors should be mindful that analysts, like any human, can have subjective perspectives influencing their forecasts.
Breaking: Wall Street's Next Big Mover
Benzinga's #1 analyst just identified a stock poised for explosive growth. This under-the-radar company could surge 200%+ as major market shifts unfold. Click here for urgent details.
This article was generated by Benzinga's automated content engine and reviewed by an editor.
© 2025 Benzinga.com. Benzinga does not provide investment advice. All rights reserved.
date | ticker | name | Price Target | Upside/Downside | Recommendation | Firm |
|---|
Trade confidently with insights and alerts from analyst ratings, free reports and breaking news that affects the stocks you care about.

