
Providing a diverse range of perspectives from bullish to bearish, 6 analysts have published ratings on Trex Co TREX in the last three months.
The table below offers a condensed view of their recent ratings, showcasing the changing sentiments over the past 30 days and comparing them to the preceding months.
| Bullish | Somewhat Bullish | Indifferent | Somewhat Bearish | Bearish | |
|---|---|---|---|---|---|
| Total Ratings | 2 | 0 | 4 | 0 | 0 |
| Last 30D | 2 | 0 | 3 | 0 | 0 |
| 1M Ago | 0 | 0 | 0 | 0 | 0 |
| 2M Ago | 0 | 0 | 1 | 0 | 0 |
| 3M Ago | 0 | 0 | 0 | 0 | 0 |
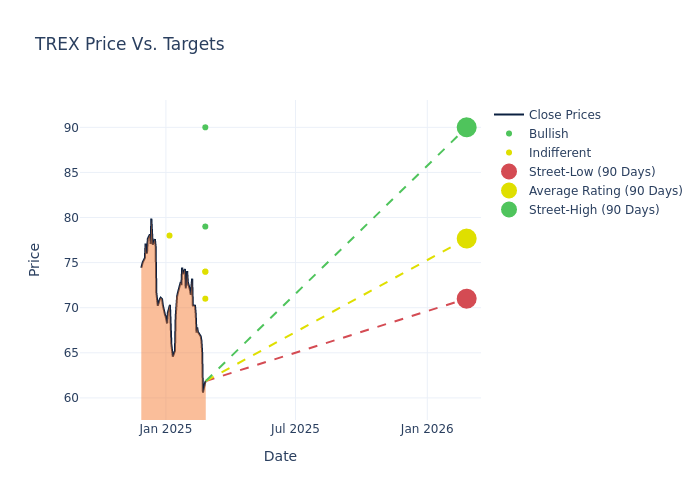
Analysts provide deeper insights through their assessments of 12-month price targets, revealing an average target of $77.67, a high estimate of $90.00, and a low estimate of $71.00. This current average represents a 6.79% decrease from the previous average price target of $83.33.
Exploring Analyst Ratings: An In-Depth Overview
A clear picture of Trex Co's perception among financial experts is painted with a thorough analysis of recent analyst actions. The summary below outlines key analysts, their recent evaluations, and adjustments to ratings and price targets.
| Analyst | Analyst Firm | Action Taken | Rating | Current Price Target | Prior Price Target |
|---|---|---|---|---|---|
| Philip Ng | Jefferies | Lowers | Hold | $71.00 | $81.00 |
| Kurt Yinger | DA Davidson | Maintains | Neutral | $74.00 | $74.00 |
| Keith Hughes | Truist Securities | Lowers | Buy | $90.00 | $100.00 |
| John Lovallo | UBS | Lowers | Neutral | $74.00 | $76.00 |
| Rafe Jadrosich | B of A Securities | Lowers | Buy | $79.00 | $85.00 |
| Anthony Pettinari | Citigroup | Lowers | Neutral | $78.00 | $84.00 |
Key Insights:
- Action Taken: Analysts respond to changes in market conditions and company performance, frequently updating their recommendations. Whether they 'Maintain', 'Raise' or 'Lower' their stance, it reflects their reaction to recent developments related to Trex Co. This information offers a snapshot of how analysts perceive the current state of the company.
- Rating: Analyzing trends, analysts offer qualitative evaluations, ranging from 'Outperform' to 'Underperform'. These ratings convey expectations for the relative performance of Trex Co compared to the broader market.
- Price Targets: Analysts predict movements in price targets, offering estimates for Trex Co's future value. Examining the current and prior targets offers insights into analysts' evolving expectations.
Analyzing these analyst evaluations alongside relevant financial metrics can provide a comprehensive view of Trex Co's market position. Stay informed and make data-driven decisions with the assistance of our Ratings Table.
Stay up to date on Trex Co analyst ratings.
Unveiling the Story Behind Trex Co
Trex Co Inc is a manufacturer of wooden alternative decking products. The company offers outdoor products in the decking, railing, porch, fencing, trim, steel deck framing, and outdoor lighting categories. Its products are sold under the Trex brand and manufactured in the United States. Further, the company licenses its Trex brand to third parties to manufacture and sell products under the Trex trademark. The distribution is focused on wholesale distributors and retail lumber dealers, which in turn sell Trex products to homeowners and contractors, with an emphasis on professional contractors, remodelers, and homebuilders. The company operates in one reportable segment i.e. Trex Residential.
Breaking Down Trex Co's Financial Performance
Market Capitalization Analysis: Positioned below industry benchmarks, the company's market capitalization faces constraints in size. This could be influenced by factors such as growth expectations or operational capacity.
Revenue Growth: Trex Co's revenue growth over a period of 3 months has faced challenges. As of 30 September, 2024, the company experienced a revenue decline of approximately -23.08%. This indicates a decrease in the company's top-line earnings. When compared to others in the Industrials sector, the company faces challenges, achieving a growth rate lower than the average among peers.
Net Margin: Trex Co's net margin surpasses industry standards, highlighting the company's exceptional financial performance. With an impressive 17.35% net margin, the company effectively manages costs and achieves strong profitability.
Return on Equity (ROE): Trex Co's ROE lags behind industry averages, suggesting challenges in maximizing returns on equity capital. With an ROE of 4.55%, the company may face hurdles in achieving optimal financial performance.
Return on Assets (ROA): The company's ROA is a standout performer, exceeding industry averages. With an impressive ROA of 3.2%, the company showcases effective utilization of assets.
Debt Management: Trex Co's debt-to-equity ratio is below the industry average. With a ratio of 0.12, the company relies less on debt financing, maintaining a healthier balance between debt and equity, which can be viewed positively by investors.
The Significance of Analyst Ratings Explained
Experts in banking and financial systems, analysts specialize in reporting for specific stocks or defined sectors. Their comprehensive research involves attending company conference calls and meetings, analyzing financial statements, and engaging with insiders to generate what are known as analyst ratings for stocks. Typically, analysts assess and rate each stock once per quarter.
Analysts may enhance their evaluations by incorporating forecasts for metrics like growth estimates, earnings, and revenue, delivering additional guidance to investors. It is vital to acknowledge that, although experts in stocks and sectors, analysts are human and express their opinions when providing insights.
Breaking: Wall Street's Next Big Mover
Benzinga's #1 analyst just identified a stock poised for explosive growth. This under-the-radar company could surge 200%+ as major market shifts unfold. Click here for urgent details.
This article was generated by Benzinga's automated content engine and reviewed by an editor.
© 2025 Benzinga.com. Benzinga does not provide investment advice. All rights reserved.
date | ticker | name | Price Target | Upside/Downside | Recommendation | Firm |
|---|
Trade confidently with insights and alerts from analyst ratings, free reports and breaking news that affects the stocks you care about.

