


Ratings for Rush Street Interactive RSI were provided by 5 analysts in the past three months, showcasing a mix of bullish and bearish perspectives.
In the table below, you'll find a summary of their recent ratings, revealing the shifting sentiments over the past 30 days and comparing them to the previous months.
| Bullish | Somewhat Bullish | Indifferent | Somewhat Bearish | Bearish | |
|---|---|---|---|---|---|
| Total Ratings | 3 | 1 | 1 | 0 | 0 |
| Last 30D | 1 | 1 | 0 | 0 | 0 |
| 1M Ago | 0 | 0 | 1 | 0 | 0 |
| 2M Ago | 2 | 0 | 0 | 0 | 0 |
| 3M Ago | 0 | 0 | 0 | 0 | 0 |
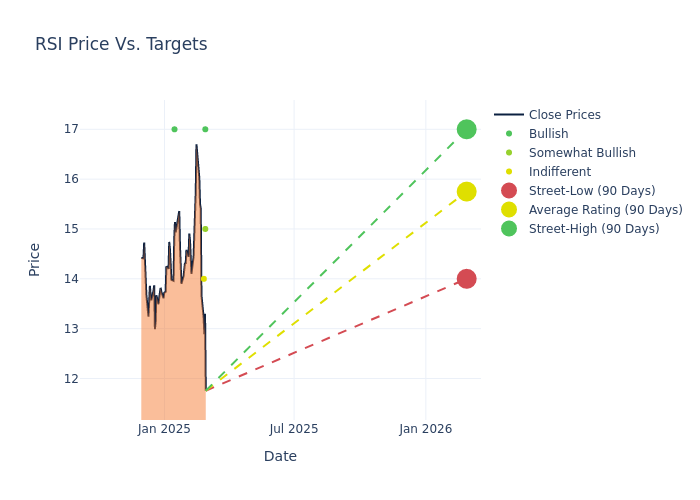
Analysts' evaluations of 12-month price targets offer additional insights, showcasing an average target of $16.0, with a high estimate of $17.00 and a low estimate of $14.00. Witnessing a positive shift, the current average has risen by 8.11% from the previous average price target of $14.80.
Analyzing Analyst Ratings: A Detailed Breakdown
The standing of Rush Street Interactive among financial experts is revealed through an in-depth exploration of recent analyst actions. The summary below outlines key analysts, their recent evaluations, and adjustments to ratings and price targets.
| Analyst | Analyst Firm | Action Taken | Rating | Current Price Target | Prior Price Target |
|---|---|---|---|---|---|
| Daniel Politzer | Wells Fargo | Raises | Overweight | $15.00 | $14.00 |
| Bernie McTernan | Needham | Maintains | Buy | $17.00 | $17.00 |
| Joseph Stauff | Susquehanna | Raises | Neutral | $14.00 | $12.00 |
| Bernie McTernan | Needham | Raises | Buy | $17.00 | $15.00 |
| David Katz | Jefferies | Raises | Buy | $17.00 | $16.00 |
Key Insights:
- Action Taken: Analysts adapt their recommendations to changing market conditions and company performance. Whether they 'Maintain', 'Raise' or 'Lower' their stance, it reflects their response to recent developments related to Rush Street Interactive. This information provides a snapshot of how analysts perceive the current state of the company.
- Rating: Offering a comprehensive view, analysts assess stocks qualitatively, spanning from 'Outperform' to 'Underperform'. These ratings convey expectations for the relative performance of Rush Street Interactive compared to the broader market.
- Price Targets: Analysts predict movements in price targets, offering estimates for Rush Street Interactive's future value. Examining the current and prior targets offers insights into analysts' evolving expectations.
For valuable insights into Rush Street Interactive's market performance, consider these analyst evaluations alongside crucial financial indicators. Stay well-informed and make prudent decisions using our Ratings Table.
Stay up to date on Rush Street Interactive analyst ratings.
If you are interested in following small-cap stock news and performance you can start by tracking it here.
Discovering Rush Street Interactive: A Closer Look
Rush Street Interactive Inc is an online gaming and entertainment company that focuses primarily on online casinos and online sports betting in the U.S. and Latin American markets. It provides customers with an array of gaming offerings such as real-money online casinos, online sports betting, and retail sports betting, as well as social gaming, which involves free-to-play games that use virtual credits that can be earned or purchased. The company generates revenue by offering online casinos, online sports betting, and social gaming directly to the end customer through its websites or apps. The company generates revenue through business-to-consumer (B2C) and business-to-business (B2B) models.
Understanding the Numbers: Rush Street Interactive's Finances
Market Capitalization Analysis: Reflecting a smaller scale, the company's market capitalization is positioned below industry averages. This could be attributed to factors such as growth expectations or operational capacity.
Positive Revenue Trend: Examining Rush Street Interactive's financials over 3 months reveals a positive narrative. The company achieved a noteworthy revenue growth rate of 36.63% as of 30 September, 2024, showcasing a substantial increase in top-line earnings. As compared to its peers, the company achieved a growth rate higher than the average among peers in Consumer Discretionary sector.
Net Margin: Rush Street Interactive's net margin is below industry averages, indicating potential challenges in maintaining strong profitability. With a net margin of 0.51%, the company may face hurdles in effective cost management.
Return on Equity (ROE): The company's ROE is a standout performer, exceeding industry averages. With an impressive ROE of 1.79%, the company showcases effective utilization of equity capital.
Return on Assets (ROA): Rush Street Interactive's ROA is below industry averages, indicating potential challenges in efficiently utilizing assets. With an ROA of 0.34%, the company may face hurdles in achieving optimal financial returns.
Debt Management: The company maintains a balanced debt approach with a debt-to-equity ratio below industry norms, standing at 0.08.
How Are Analyst Ratings Determined?
Experts in banking and financial systems, analysts specialize in reporting for specific stocks or defined sectors. Their comprehensive research involves attending company conference calls and meetings, analyzing financial statements, and engaging with insiders to generate what are known as analyst ratings for stocks. Typically, analysts assess and rate each stock once per quarter.
Some analysts publish their predictions for metrics such as growth estimates, earnings, and revenue to provide additional guidance with their ratings. When using analyst ratings, it is important to keep in mind that stock and sector analysts are also human and are only offering their opinions to investors.
Breaking: Wall Street's Next Big Mover
Benzinga's #1 analyst just identified a stock poised for explosive growth. This under-the-radar company could surge 200%+ as major market shifts unfold. Click here for urgent details.
This article was generated by Benzinga's automated content engine and reviewed by an editor.
Edge Rankings
Price Trend
© 2025 Benzinga.com. Benzinga does not provide investment advice. All rights reserved.
date | ticker | name | Price Target | Upside/Downside | Recommendation | Firm |
|---|
Trade confidently with insights and alerts from analyst ratings, free reports and breaking news that affects the stocks you care about.

