


Across the recent three months, 12 analysts have shared their insights on EOG Resources EOG, expressing a variety of opinions spanning from bullish to bearish.
The following table encapsulates their recent ratings, offering a glimpse into the evolving sentiments over the past 30 days and comparing them to the preceding months.
| Bullish | Somewhat Bullish | Indifferent | Somewhat Bearish | Bearish | |
|---|---|---|---|---|---|
| Total Ratings | 2 | 2 | 8 | 0 | 0 |
| Last 30D | 0 | 0 | 1 | 0 | 0 |
| 1M Ago | 1 | 0 | 2 | 0 | 0 |
| 2M Ago | 1 | 0 | 4 | 0 | 0 |
| 3M Ago | 0 | 2 | 1 | 0 | 0 |
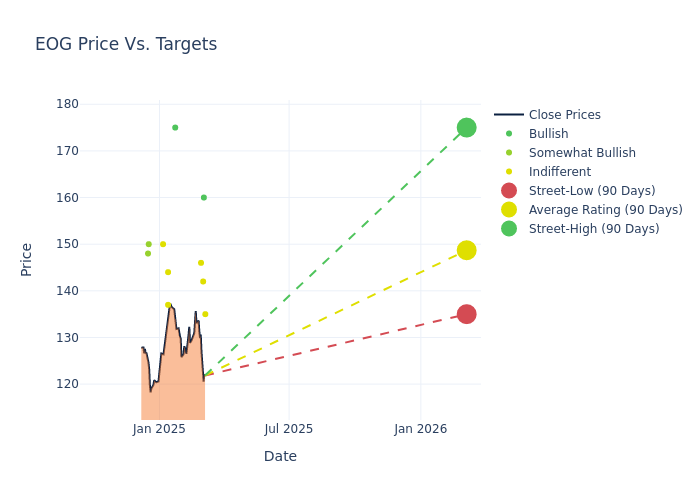
The 12-month price targets, analyzed by analysts, offer insights with an average target of $147.33, a high estimate of $175.00, and a low estimate of $135.00. A 1.34% drop is evident in the current average compared to the previous average price target of $149.33.
Breaking Down Analyst Ratings: A Detailed Examination
The standing of EOG Resources among financial experts becomes clear with a thorough analysis of recent analyst actions. The summary below outlines key analysts, their recent evaluations, and adjustments to ratings and price targets.
| Analyst | Analyst Firm | Action Taken | Rating | Current Price Target | Prior Price Target |
|---|---|---|---|---|---|
| Mark Lear | Piper Sandler | Lowers | Neutral | $135.00 | $141.00 |
| Josh Silverstein | UBS | Lowers | Buy | $160.00 | $165.00 |
| Devin McDermott | Morgan Stanley | Lowers | Equal-Weight | $142.00 | $143.00 |
| Betty Jiang | Barclays | Lowers | Equal-Weight | $146.00 | $148.00 |
| Mark Lear | Piper Sandler | Raises | Neutral | $141.00 | $140.00 |
| John Freeman | Raymond James | Raises | Strong Buy | $175.00 | $167.00 |
| Neal Dingmann | Truist Securities | Raises | Hold | $137.00 | $135.00 |
| Noah Hungness | B of A Securities | Lowers | Neutral | $144.00 | $151.00 |
| Scott Hanold | RBC Capital | Maintains | Sector Perform | $150.00 | $150.00 |
| Mark Lear | Piper Sandler | Lowers | Neutral | $140.00 | $149.00 |
| Roger Read | Wells Fargo | Raises | Overweight | $150.00 | $147.00 |
| Nitin Kumar | Mizuho | Lowers | Outperform | $148.00 | $156.00 |
Key Insights:
- Action Taken: Responding to changing market dynamics and company performance, analysts update their recommendations. Whether they 'Maintain', 'Raise', or 'Lower' their stance, it signifies their response to recent developments related to EOG Resources. This offers insight into analysts' perspectives on the current state of the company.
- Rating: Analysts assign qualitative assessments to stocks, ranging from 'Outperform' to 'Underperform'. These ratings convey the analysts' expectations for the relative performance of EOG Resources compared to the broader market.
- Price Targets: Analysts gauge the dynamics of price targets, providing estimates for the future value of EOG Resources's stock. This comparison reveals trends in analysts' expectations over time.
Understanding these analyst evaluations alongside key financial indicators can offer valuable insights into EOG Resources's market standing. Stay informed and make well-considered decisions with our Ratings Table.
Stay up to date on EOG Resources analyst ratings.
Get to Know EOG Resources Better
EOG Resources is an oil and gas producer with acreage in several US shale plays, primarily in the Permian Basin and the Eagle Ford. At the end of 2024, it reported net proven reserves of 4.7 billion barrels of oil equivalent. Net production averaged roughly 1,062 thousand barrels of oil equivalent per day in 2024 at a ratio of 69% oil and natural gas liquids and 31% natural gas.
Key Indicators: EOG Resources's Financial Health
Market Capitalization: Surpassing industry standards, the company's market capitalization asserts its dominance in terms of size, suggesting a robust market position.
Decline in Revenue: Over the 3 months period, EOG Resources faced challenges, resulting in a decline of approximately -6.3% in revenue growth as of 31 December, 2024. This signifies a reduction in the company's top-line earnings. In comparison to its industry peers, the company trails behind with a growth rate lower than the average among peers in the Energy sector.
Net Margin: EOG Resources's net margin surpasses industry standards, highlighting the company's exceptional financial performance. With an impressive 22.14% net margin, the company effectively manages costs and achieves strong profitability.
Return on Equity (ROE): EOG Resources's financial strength is reflected in its exceptional ROE, which exceeds industry averages. With a remarkable ROE of 4.25%, the company showcases efficient use of equity capital and strong financial health.
Return on Assets (ROA): EOG Resources's financial strength is reflected in its exceptional ROA, which exceeds industry averages. With a remarkable ROA of 2.68%, the company showcases efficient use of assets and strong financial health.
Debt Management: The company maintains a balanced debt approach with a debt-to-equity ratio below industry norms, standing at 0.17.
The Significance of Analyst Ratings Explained
Analyst ratings serve as essential indicators of stock performance, provided by experts in banking and financial systems. These specialists diligently analyze company financial statements, participate in conference calls, and engage with insiders to generate quarterly ratings for individual stocks.
Some analysts publish their predictions for metrics such as growth estimates, earnings, and revenue to provide additional guidance with their ratings. When using analyst ratings, it is important to keep in mind that stock and sector analysts are also human and are only offering their opinions to investors.
If you want to keep track of which analysts are outperforming others, you can view updated analyst ratings along withanalyst success scores in Benzinga Pro.
Which Stocks Are Analysts Recommending Now?
Benzinga Edge gives you instant access to all major analyst upgrades, downgrades, and price targets. Sort by accuracy, upside potential, and more. Click here to stay ahead of the market.
This article was generated by Benzinga's automated content engine and reviewed by an editor.
Edge Rankings
Price Trend
© 2025 Benzinga.com. Benzinga does not provide investment advice. All rights reserved.
date | ticker | name | Price Target | Upside/Downside | Recommendation | Firm |
|---|
Trade confidently with insights and alerts from analyst ratings, free reports and breaking news that affects the stocks you care about.

