
Analysts' ratings for 3M MMM over the last quarter vary from bullish to bearish, as provided by 11 analysts.
The following table provides a quick overview of their recent ratings, highlighting the changing sentiments over the past 30 days and comparing them to the preceding months.
| Bullish | Somewhat Bullish | Indifferent | Somewhat Bearish | Bearish | |
|---|---|---|---|---|---|
| Total Ratings | 2 | 5 | 1 | 3 | 0 |
| Last 30D | 1 | 0 | 0 | 0 | 0 |
| 1M Ago | 0 | 0 | 0 | 1 | 0 |
| 2M Ago | 1 | 5 | 1 | 1 | 0 |
| 3M Ago | 0 | 0 | 0 | 1 | 0 |
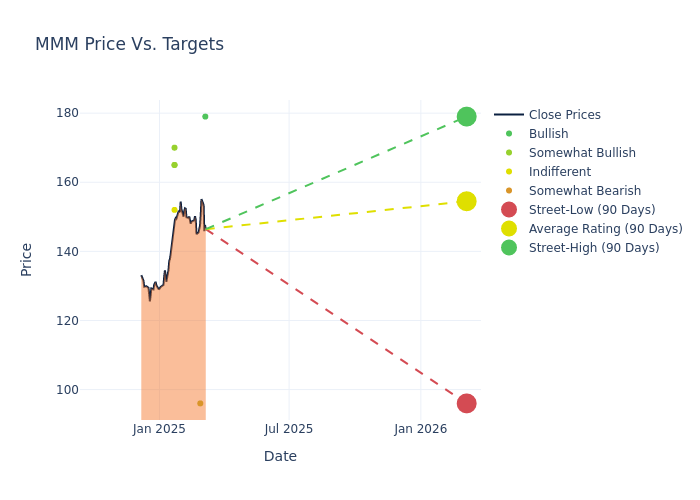
Analysts have recently evaluated 3M and provided 12-month price targets. The average target is $147.0, accompanied by a high estimate of $179.00 and a low estimate of $96.00. This current average has increased by 3.52% from the previous average price target of $142.00.
Understanding Analyst Ratings: A Comprehensive Breakdown
A comprehensive examination of how financial experts perceive 3M is derived from recent analyst actions. The following is a detailed summary of key analysts, their recent evaluations, and adjustments to ratings and price targets.
| Analyst | Analyst Firm | Action Taken | Rating | Current Price Target | Prior Price Target |
|---|---|---|---|---|---|
| Andrew Obin | B of A Securities | Raises | Buy | $179.00 | $175.00 |
| Deane Dray | RBC Capital | Maintains | Underperform | $96.00 | $96.00 |
| Deane Dray | RBC Capital | Maintains | Underperform | $96.00 | $96.00 |
| Andrew Obin | B of A Securities | Raises | Buy | $175.00 | $160.00 |
| Andrew Kaplowitz | Citigroup | Raises | Neutral | $152.00 | $142.00 |
| Julian Mitchell | Barclays | Raises | Overweight | $165.00 | $161.00 |
| Stephen Tusa | JP Morgan | Raises | Overweight | $165.00 | $162.00 |
| Joe O'Dea | Wells Fargo | Raises | Overweight | $170.00 | $140.00 |
| Stephen Tusa | JP Morgan | Lowers | Overweight | $162.00 | $165.00 |
| Julian Mitchell | Barclays | Lowers | Overweight | $161.00 | $165.00 |
| Matthew Swanson | RBC Capital | Lowers | Underperform | $96.00 | $100.00 |
Key Insights:
- Action Taken: Analysts adapt their recommendations to changing market conditions and company performance. Whether they 'Maintain', 'Raise' or 'Lower' their stance, it reflects their response to recent developments related to 3M. This information provides a snapshot of how analysts perceive the current state of the company.
- Rating: Analysts assign qualitative assessments to stocks, ranging from 'Outperform' to 'Underperform'. These ratings convey the analysts' expectations for the relative performance of 3M compared to the broader market.
- Price Targets: Analysts predict movements in price targets, offering estimates for 3M's future value. Examining the current and prior targets offers insights into analysts' evolving expectations.
Assessing these analyst evaluations alongside crucial financial indicators can provide a comprehensive overview of 3M's market position. Stay informed and make well-judged decisions with the assistance of our Ratings Table.
Stay up to date on 3M analyst ratings.
About 3M
3M, a multinational conglomerate founded in 1902, sells tens of thousands of products ranging from sponges to respirators. The firm is well known for its extensive research and development capabilities, and it is a pioneer in inventing new use cases for its proprietary technologies. 3M is organized across three business segments: safety and industrial (representing around 44% of revenue), transportation and electronics (36%), and consumer (20%). The firm recently spun off its healthcare business, now known as Solventum. Nearly half of 3M's revenue comes from outside the Americas.
3M: Financial Performance Dissected
Market Capitalization: Surpassing industry standards, the company's market capitalization asserts its dominance in terms of size, suggesting a robust market position.
Revenue Growth: 3M's revenue growth over a period of 3 months has been noteworthy. As of 31 December, 2024, the company achieved a revenue growth rate of approximately 0.13%. This indicates a substantial increase in the company's top-line earnings. As compared to its peers, the company achieved a growth rate higher than the average among peers in Industrials sector.
Net Margin: 3M's net margin is impressive, surpassing industry averages. With a net margin of 12.11%, the company demonstrates strong profitability and effective cost management.
Return on Equity (ROE): 3M's ROE stands out, surpassing industry averages. With an impressive ROE of 17.16%, the company demonstrates effective use of equity capital and strong financial performance.
Return on Assets (ROA): 3M's financial strength is reflected in its exceptional ROA, which exceeds industry averages. With a remarkable ROA of 1.8%, the company showcases efficient use of assets and strong financial health.
Debt Management: The company maintains a balanced debt approach with a debt-to-equity ratio below industry norms, standing at 3.56.
How Are Analyst Ratings Determined?
Benzinga tracks 150 analyst firms and reports on their stock expectations. Analysts typically arrive at their conclusions by predicting how much money a company will make in the future, usually the upcoming five years, and how risky or predictable that company's revenue streams are.
Analysts attend company conference calls and meetings, research company financial statements, and communicate with insiders to publish their ratings on stocks. Analysts typically rate each stock once per quarter or whenever the company has a major update.
Some analysts also offer predictions for helpful metrics such as earnings, revenue, and growth estimates to provide further guidance as to what to do with certain tickers. It is important to keep in mind that while stock and sector analysts are specialists, they are also human and can only forecast their beliefs to traders.
Breaking: Wall Street's Next Big Mover
Benzinga's #1 analyst just identified a stock poised for explosive growth. This under-the-radar company could surge 200%+ as major market shifts unfold. Click here for urgent details.
This article was generated by Benzinga's automated content engine and reviewed by an editor.
© 2025 Benzinga.com. Benzinga does not provide investment advice. All rights reserved.
date | ticker | name | Price Target | Upside/Downside | Recommendation | Firm |
|---|
Trade confidently with insights and alerts from analyst ratings, free reports and breaking news that affects the stocks you care about.

