


Analysts' ratings for GMS GMS over the last quarter vary from bullish to bearish, as provided by 5 analysts.
The table below offers a condensed view of their recent ratings, showcasing the changing sentiments over the past 30 days and comparing them to the preceding months.
| Bullish | Somewhat Bullish | Indifferent | Somewhat Bearish | Bearish | |
|---|---|---|---|---|---|
| Total Ratings | 0 | 1 | 4 | 0 | 0 |
| Last 30D | 0 | 1 | 2 | 0 | 0 |
| 1M Ago | 0 | 0 | 0 | 0 | 0 |
| 2M Ago | 0 | 0 | 1 | 0 | 0 |
| 3M Ago | 0 | 0 | 1 | 0 | 0 |
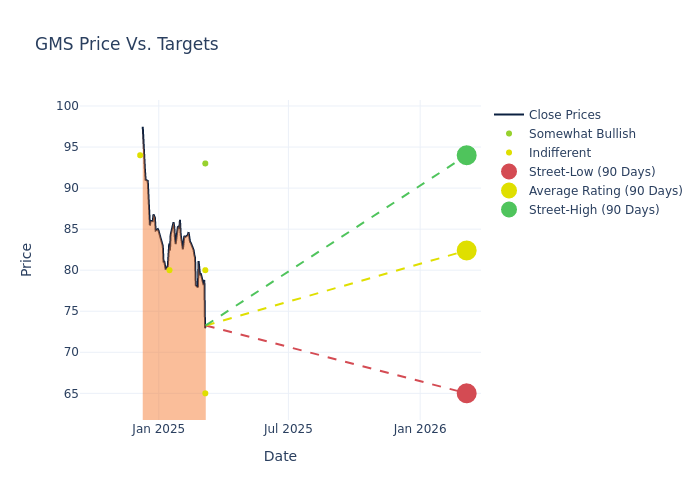
Analysts provide deeper insights through their assessments of 12-month price targets, revealing an average target of $83.0, a high estimate of $97.00, and a low estimate of $65.00. A decline of 12.08% from the prior average price target is evident in the current average.
Breaking Down Analyst Ratings: A Detailed Examination
The perception of GMS by financial experts is analyzed through recent analyst actions. The following summary presents key analysts, their recent evaluations, and adjustments to ratings and price targets.
| Analyst | Analyst Firm | Action Taken | Rating | Current Price Target | Prior Price Target |
|---|---|---|---|---|---|
| Mike Dahl | RBC Capital | Lowers | Sector Perform | $65.00 | $82.00 |
| Keith Hughes | Truist Securities | Lowers | Hold | $80.00 | $97.00 |
| David Manthey | Baird | Lowers | Outperform | $93.00 | $110.00 |
| Matthew Bouley | Barclays | Lowers | Equal-Weight | $80.00 | $93.00 |
| Keith Hughes | Truist Securities | Raises | Hold | $97.00 | $90.00 |
Key Insights:
- Action Taken: Analysts respond to changes in market conditions and company performance, frequently updating their recommendations. Whether they 'Maintain', 'Raise' or 'Lower' their stance, it reflects their reaction to recent developments related to GMS. This information offers a snapshot of how analysts perceive the current state of the company.
- Rating: Offering a comprehensive view, analysts assess stocks qualitatively, spanning from 'Outperform' to 'Underperform'. These ratings convey expectations for the relative performance of GMS compared to the broader market.
- Price Targets: Understanding forecasts, analysts offer estimates for GMS's future value. Examining the current and prior targets provides insight into analysts' changing expectations.
Considering these analyst evaluations in conjunction with other financial indicators can offer a comprehensive understanding of GMS's market position. Stay informed and make well-informed decisions with our Ratings Table.
Stay up to date on GMS analyst ratings.
Delving into GMS's Background
GMS Inc is a distributor of specialty building products including wallboard, suspended ceiling systems, ceilings, steel framing, and other complementary building products. The company serves its products to commercial new construction, commercial repair and remodel, residential new construction, and residential repair and remodel (R&R). Its geographical segment is Central, Midwest, New York, Northeast, Southern, Southeast, Southwest, Western and Canada, and Ames. The company generates maximum revenue from Wallboard products.
GMS's Economic Impact: An Analysis
Market Capitalization Analysis: Reflecting a smaller scale, the company's market capitalization is positioned below industry averages. This could be attributed to factors such as growth expectations or operational capacity.
Revenue Growth: GMS's revenue growth over a period of 3 months has been noteworthy. As of 31 October, 2024, the company achieved a revenue growth rate of approximately 3.51%. This indicates a substantial increase in the company's top-line earnings. As compared to competitors, the company encountered difficulties, with a growth rate lower than the average among peers in the Industrials sector.
Net Margin: GMS's net margin falls below industry averages, indicating challenges in achieving strong profitability. With a net margin of 3.64%, the company may face hurdles in effective cost management.
Return on Equity (ROE): The company's ROE is below industry benchmarks, signaling potential difficulties in efficiently using equity capital. With an ROE of 3.64%, the company may need to address challenges in generating satisfactory returns for shareholders.
Return on Assets (ROA): GMS's ROA falls below industry averages, indicating challenges in efficiently utilizing assets. With an ROA of 1.35%, the company may face hurdles in generating optimal returns from its assets.
Debt Management: GMS's debt-to-equity ratio is below industry norms, indicating a sound financial structure with a ratio of 1.21.
Analyst Ratings: Simplified
Analysts work in banking and financial systems and typically specialize in reporting for stocks or defined sectors. Analysts may attend company conference calls and meetings, research company financial statements, and communicate with insiders to publish "analyst ratings" for stocks. Analysts typically rate each stock once per quarter.
In addition to their assessments, some analysts extend their insights by offering predictions for key metrics such as earnings, revenue, and growth estimates. This supplementary information provides further guidance for traders. It is crucial to recognize that, despite their specialization, analysts are human and can only provide forecasts based on their beliefs.
Which Stocks Are Analysts Recommending Now?
Benzinga Edge gives you instant access to all major analyst upgrades, downgrades, and price targets. Sort by accuracy, upside potential, and more. Click here to stay ahead of the market.
This article was generated by Benzinga's automated content engine and reviewed by an editor.
Edge Rankings
Price Trend
© 2025 Benzinga.com. Benzinga does not provide investment advice. All rights reserved.
date | ticker | name | Price Target | Upside/Downside | Recommendation | Firm |
|---|
Trade confidently with insights and alerts from analyst ratings, free reports and breaking news that affects the stocks you care about.

