


Ratings for HF Sinclair DINO were provided by 4 analysts in the past three months, showcasing a mix of bullish and bearish perspectives.
Summarizing their recent assessments, the table below illustrates the evolving sentiments in the past 30 days and compares them to the preceding months.
| Bullish | Somewhat Bullish | Indifferent | Somewhat Bearish | Bearish | |
|---|---|---|---|---|---|
| Total Ratings | 0 | 0 | 4 | 0 | 0 |
| Last 30D | 0 | 0 | 0 | 0 | 0 |
| 1M Ago | 0 | 0 | 0 | 0 | 0 |
| 2M Ago | 0 | 0 | 1 | 0 | 0 |
| 3M Ago | 0 | 0 | 3 | 0 | 0 |
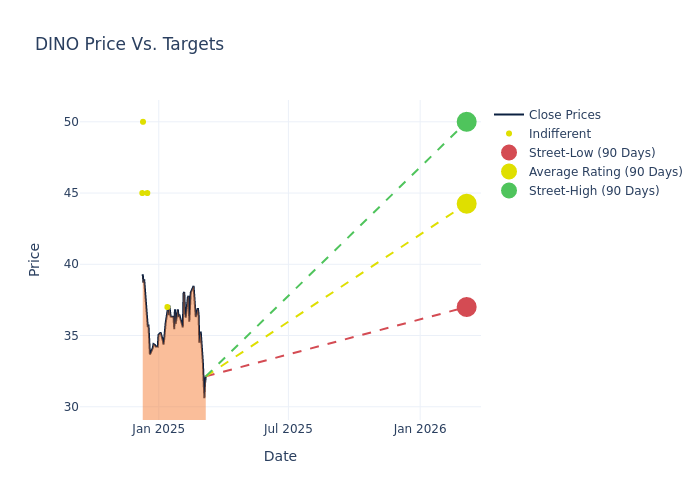
Analysts provide deeper insights through their assessments of 12-month price targets, revealing an average target of $44.25, a high estimate of $50.00, and a low estimate of $37.00. Observing a downward trend, the current average is 9.69% lower than the prior average price target of $49.00.
Diving into Analyst Ratings: An In-Depth Exploration
A clear picture of HF Sinclair's perception among financial experts is painted with a thorough analysis of recent analyst actions. The summary below outlines key analysts, their recent evaluations, and adjustments to ratings and price targets.
| Analyst | Analyst Firm | Action Taken | Rating | Current Price Target | Prior Price Target |
|---|---|---|---|---|---|
| Theresa Chen | Barclays | Lowers | Equal-Weight | $37.00 | $42.00 |
| Nitin Kumar | Mizuho | Lowers | Neutral | $45.00 | $50.00 |
| John Royall | JP Morgan | Lowers | Neutral | $50.00 | $51.00 |
| Roger Read | Wells Fargo | Lowers | Equal-Weight | $45.00 | $53.00 |
Key Insights:
- Action Taken: Analysts adapt their recommendations to changing market conditions and company performance. Whether they 'Maintain', 'Raise' or 'Lower' their stance, it reflects their response to recent developments related to HF Sinclair. This information provides a snapshot of how analysts perceive the current state of the company.
- Rating: Gaining insights, analysts provide qualitative assessments, ranging from 'Outperform' to 'Underperform'. These ratings reflect expectations for the relative performance of HF Sinclair compared to the broader market.
- Price Targets: Understanding forecasts, analysts offer estimates for HF Sinclair's future value. Examining the current and prior targets provides insight into analysts' changing expectations.
For valuable insights into HF Sinclair's market performance, consider these analyst evaluations alongside crucial financial indicators. Stay well-informed and make prudent decisions using our Ratings Table.
Stay up to date on HF Sinclair analyst ratings.
Unveiling the Story Behind HF Sinclair
HF Sinclair is an integrated petroleum refiner that owns and operates seven refineries serving the Rockies, midcontinent, Southwest, and Pacific Northwest, with a total crude oil throughput capacity of 678,000 barrels per day. It can produce 380 million gallons of renewable diesel annually. It holds a marketing business with over 300 distributors and 1,500 wholesale branded sites across 30 states. It also owns and operates 4,400 miles of petroleum product pipelines and terminals principally in the southwestern United States.
Key Indicators: HF Sinclair's Financial Health
Market Capitalization Perspectives: The company's market capitalization falls below industry averages, signaling a relatively smaller size compared to peers. This positioning may be influenced by factors such as perceived growth potential or operational scale.
Negative Revenue Trend: Examining HF Sinclair's financials over 3 months reveals challenges. As of 31 December, 2024, the company experienced a decline of approximately -15.14% in revenue growth, reflecting a decrease in top-line earnings. In comparison to its industry peers, the company stands out with a growth rate higher than the average among peers in the Energy sector.
Net Margin: HF Sinclair's financial strength is reflected in its exceptional net margin, which exceeds industry averages. With a remarkable net margin of -3.28%, the company showcases strong profitability and effective cost management.
Return on Equity (ROE): HF Sinclair's financial strength is reflected in its exceptional ROE, which exceeds industry averages. With a remarkable ROE of -2.26%, the company showcases efficient use of equity capital and strong financial health.
Return on Assets (ROA): The company's ROA is a standout performer, exceeding industry averages. With an impressive ROA of -1.27%, the company showcases effective utilization of assets.
Debt Management: HF Sinclair's debt-to-equity ratio is below industry norms, indicating a sound financial structure with a ratio of 0.33.
The Basics of Analyst Ratings
Benzinga tracks 150 analyst firms and reports on their stock expectations. Analysts typically arrive at their conclusions by predicting how much money a company will make in the future, usually the upcoming five years, and how risky or predictable that company's revenue streams are.
Analysts attend company conference calls and meetings, research company financial statements, and communicate with insiders to publish their ratings on stocks. Analysts typically rate each stock once per quarter or whenever the company has a major update.
Analysts may enhance their evaluations by incorporating forecasts for metrics like growth estimates, earnings, and revenue, delivering additional guidance to investors. It is vital to acknowledge that, although experts in stocks and sectors, analysts are human and express their opinions when providing insights.
Which Stocks Are Analysts Recommending Now?
Benzinga Edge gives you instant access to all major analyst upgrades, downgrades, and price targets. Sort by accuracy, upside potential, and more. Click here to stay ahead of the market.
This article was generated by Benzinga's automated content engine and reviewed by an editor.
Edge Rankings
Price Trend
© 2025 Benzinga.com. Benzinga does not provide investment advice. All rights reserved.
date | ticker | name | Price Target | Upside/Downside | Recommendation | Firm |
|---|
Trade confidently with insights and alerts from analyst ratings, free reports and breaking news that affects the stocks you care about.

