


In the preceding three months, 12 analysts have released ratings for CME Group CME, presenting a wide array of perspectives from bullish to bearish.
The following table provides a quick overview of their recent ratings, highlighting the changing sentiments over the past 30 days and comparing them to the preceding months.
| Bullish | Somewhat Bullish | Indifferent | Somewhat Bearish | Bearish | |
|---|---|---|---|---|---|
| Total Ratings | 0 | 3 | 8 | 1 | 0 |
| Last 30D | 0 | 1 | 0 | 0 | 0 |
| 1M Ago | 0 | 1 | 4 | 1 | 0 |
| 2M Ago | 0 | 0 | 1 | 0 | 0 |
| 3M Ago | 0 | 1 | 3 | 0 | 0 |
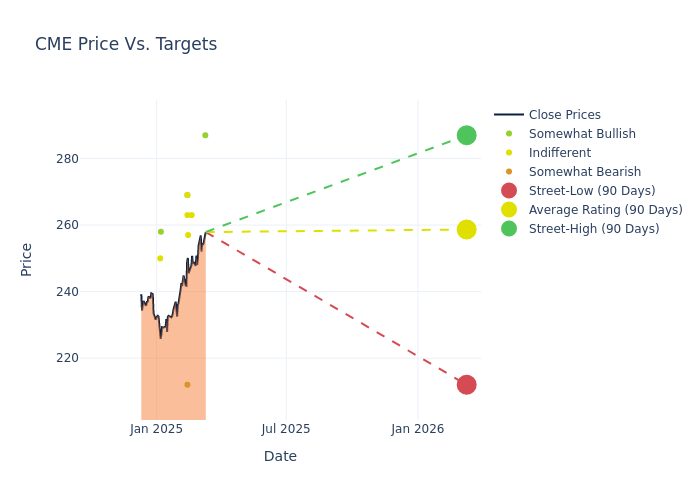
Analysts' evaluations of 12-month price targets offer additional insights, showcasing an average target of $256.58, with a high estimate of $287.00 and a low estimate of $212.00. This current average has increased by 4.22% from the previous average price target of $246.18.
Analyzing Analyst Ratings: A Detailed Breakdown
The standing of CME Group among financial experts becomes clear with a thorough analysis of recent analyst actions. The summary below outlines key analysts, their recent evaluations, and adjustments to ratings and price targets.
| Analyst | Analyst Firm | Action Taken | Rating | Current Price Target | Prior Price Target |
|---|---|---|---|---|---|
| Patrick O'Shaughnessy | Raymond James | Announces | Outperform | $287.00 | - |
| Mike Cyprys | Morgan Stanley | Raises | Equal-Weight | $263.00 | $256.00 |
| Kyle Voigt | Keefe, Bruyette & Woods | Raises | Market Perform | $257.00 | $256.00 |
| Ashish Sabadra | RBC Capital | Raises | Sector Perform | $269.00 | $235.00 |
| Owen Lau | Oppenheimer | Raises | Outperform | $269.00 | $258.00 |
| Kenneth Worthington | JP Morgan | Raises | Underweight | $212.00 | $209.00 |
| Benjamin Budish | Barclays | Raises | Equal-Weight | $263.00 | $257.00 |
| Kyle Voigt | Keefe, Bruyette & Woods | Lowers | Market Perform | $256.00 | $260.00 |
| Patrick Moley | Piper Sandler | Raises | Overweight | $258.00 | $250.00 |
| Ashish Sabadra | RBC Capital | Maintains | Sector Perform | $235.00 | $235.00 |
| Christopher Allen | Citigroup | Lowers | Neutral | $250.00 | $255.00 |
| Kyle Voigt | Keefe, Bruyette & Woods | Raises | Market Perform | $260.00 | $237.00 |
Key Insights:
- Action Taken: Analysts respond to changes in market conditions and company performance, frequently updating their recommendations. Whether they 'Maintain', 'Raise' or 'Lower' their stance, it reflects their reaction to recent developments related to CME Group. This information offers a snapshot of how analysts perceive the current state of the company.
- Rating: Offering insights into predictions, analysts assign qualitative values, from 'Outperform' to 'Underperform'. These ratings convey expectations for the relative performance of CME Group compared to the broader market.
- Price Targets: Analysts navigate through adjustments in price targets, providing estimates for CME Group's future value. Comparing current and prior targets offers insights into analysts' evolving expectations.
To gain a panoramic view of CME Group's market performance, explore these analyst evaluations alongside essential financial indicators. Stay informed and make judicious decisions using our Ratings Table.
Stay up to date on CME Group analyst ratings.
About CME Group
Based in Chicago, CME Group operates exchanges giving investors, suppliers, and businesses the ability to trade futures and derivatives based on interest rates, equity indexes, foreign currencies, energy, metals, and commodities. The Chicago Mercantile Exchange was founded in 1898 and in 2002 completed its IPO. Since then, CME Group has consolidated parts of the industry by merging with crosstown rival CBOT Holdings in 2007 before acquiring Nymex Holdings in 2008 and NEX in 2018. In addition, the company has a 27% stake in S&P Dow Jones Indices, making the Chicago Mercantile Exchange the exclusive venue to trade and clear S&P futures contracts. Through CME's acquisition of NEX, it also expanded into cash foreign exchange, fixed-income trading, and collateral optimization.
CME Group: Delving into Financials
Market Capitalization: Surpassing industry standards, the company's market capitalization asserts its dominance in terms of size, suggesting a robust market position.
Positive Revenue Trend: Examining CME Group's financials over 3 months reveals a positive narrative. The company achieved a noteworthy revenue growth rate of 5.98% as of 31 December, 2024, showcasing a substantial increase in top-line earnings. When compared to others in the Financials sector, the company faces challenges, achieving a growth rate lower than the average among peers.
Net Margin: The company's net margin is a standout performer, exceeding industry averages. With an impressive net margin of 56.62%, the company showcases strong profitability and effective cost control.
Return on Equity (ROE): CME Group's ROE stands out, surpassing industry averages. With an impressive ROE of 3.16%, the company demonstrates effective use of equity capital and strong financial performance.
Return on Assets (ROA): The company's ROA is below industry benchmarks, signaling potential difficulties in efficiently utilizing assets. With an ROA of 0.63%, the company may need to address challenges in generating satisfactory returns from its assets.
Debt Management: CME Group's debt-to-equity ratio is below the industry average at 0.13, reflecting a lower dependency on debt financing and a more conservative financial approach.
How Are Analyst Ratings Determined?
Analysts are specialists within banking and financial systems that typically report for specific stocks or within defined sectors. These people research company financial statements, sit in conference calls and meetings, and speak with relevant insiders to determine what are known as analyst ratings for stocks. Typically, analysts will rate each stock once a quarter.
Some analysts publish their predictions for metrics such as growth estimates, earnings, and revenue to provide additional guidance with their ratings. When using analyst ratings, it is important to keep in mind that stock and sector analysts are also human and are only offering their opinions to investors.
Breaking: Wall Street's Next Big Mover
Benzinga's #1 analyst just identified a stock poised for explosive growth. This under-the-radar company could surge 200%+ as major market shifts unfold. Click here for urgent details.
This article was generated by Benzinga's automated content engine and reviewed by an editor.
Edge Rankings
Price Trend
© 2025 Benzinga.com. Benzinga does not provide investment advice. All rights reserved.
date | ticker | name | Price Target | Upside/Downside | Recommendation | Firm |
|---|
Trade confidently with insights and alerts from analyst ratings, free reports and breaking news that affects the stocks you care about.

