


In the last three months, 4 analysts have published ratings on Holley HLLY, offering a diverse range of perspectives from bullish to bearish.
In the table below, you'll find a summary of their recent ratings, revealing the shifting sentiments over the past 30 days and comparing them to the previous months.
| Bullish | Somewhat Bullish | Indifferent | Somewhat Bearish | Bearish | |
|---|---|---|---|---|---|
| Total Ratings | 0 | 4 | 0 | 0 | 0 |
| Last 30D | 0 | 2 | 0 | 0 | 0 |
| 1M Ago | 0 | 1 | 0 | 0 | 0 |
| 2M Ago | 0 | 0 | 0 | 0 | 0 |
| 3M Ago | 0 | 1 | 0 | 0 | 0 |
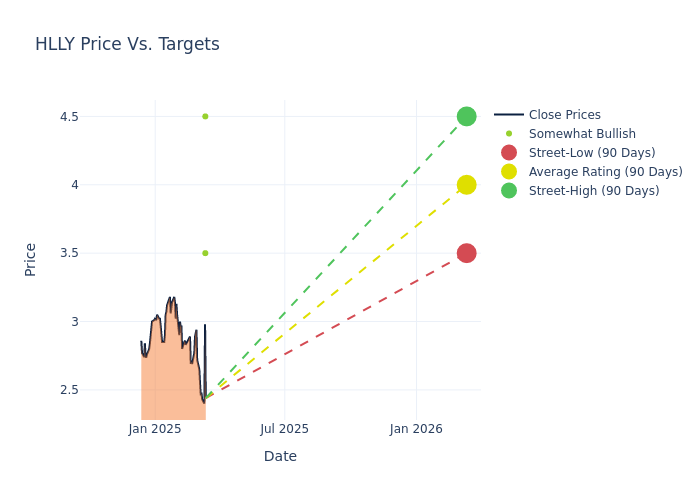
Analysts have set 12-month price targets for Holley, revealing an average target of $4.25, a high estimate of $4.50, and a low estimate of $3.50. This upward trend is evident, with the current average reflecting a 3.16% increase from the previous average price target of $4.12.
Decoding Analyst Ratings: A Detailed Look
The analysis of recent analyst actions sheds light on the perception of Holley by financial experts. The following summary presents key analysts, their recent evaluations, and adjustments to ratings and price targets.
| Analyst | Analyst Firm | Action Taken | Rating | Current Price Target | Prior Price Target |
|---|---|---|---|---|---|
| Joseph Altobello | Raymond James | Raises | Outperform | $3.50 | $3.00 |
| Joseph Feldman | Telsey Advisory Group | Maintains | Outperform | $4.50 | $4.50 |
| Joseph Feldman | Telsey Advisory Group | Maintains | Outperform | $4.50 | $4.50 |
| Joseph Feldman | Telsey Advisory Group | Maintains | Outperform | $4.50 | $4.50 |
Key Insights:
- Action Taken: Analysts frequently update their recommendations based on evolving market conditions and company performance. Whether they 'Maintain', 'Raise' or 'Lower' their stance, it reflects their reaction to recent developments related to Holley. This information provides a snapshot of how analysts perceive the current state of the company.
- Rating: Gaining insights, analysts provide qualitative assessments, ranging from 'Outperform' to 'Underperform'. These ratings reflect expectations for the relative performance of Holley compared to the broader market.
- Price Targets: Understanding forecasts, analysts offer estimates for Holley's future value. Examining the current and prior targets provides insight into analysts' changing expectations.
Understanding these analyst evaluations alongside key financial indicators can offer valuable insights into Holley's market standing. Stay informed and make well-considered decisions with our Ratings Table.
Stay up to date on Holley analyst ratings.
If you are interested in following small-cap stock news and performance you can start by tracking it here.
Unveiling the Story Behind Holley
Holley Inc is a designer, marketer, and manufacturer of high-performance automotive aftermarket products, featuring a portfolio of iconic brands serving the car and truck industry. It offers a diversified line of performance automotive products including fuel injection systems, tuners, exhaust products, carburetors, safety equipment and various other performance automotive products. The Company's products are designed to enhance street, off-road, recreational and competitive vehicle performance through increased horsepower, torque and drivability. The company's brands include Holley, APR, MSD and Flowmaster, among others. It derives revenue from the U.S. and Italy, of which prime revenue is derived from the U.S.
Holley: Delving into Financials
Market Capitalization Analysis: Positioned below industry benchmarks, the company's market capitalization faces constraints in size. This could be influenced by factors such as growth expectations or operational capacity.
Revenue Growth: Holley's revenue growth over a period of 3 months has faced challenges. As of 30 September, 2024, the company experienced a revenue decline of approximately -14.37%. This indicates a decrease in the company's top-line earnings. As compared to competitors, the company encountered difficulties, with a growth rate lower than the average among peers in the Consumer Discretionary sector.
Net Margin: Holley's net margin is below industry averages, indicating potential challenges in maintaining strong profitability. With a net margin of -4.69%, the company may face hurdles in effective cost management.
Return on Equity (ROE): Holley's ROE lags behind industry averages, suggesting challenges in maximizing returns on equity capital. With an ROE of -1.36%, the company may face hurdles in achieving optimal financial performance.
Return on Assets (ROA): Holley's ROA lags behind industry averages, suggesting challenges in maximizing returns from its assets. With an ROA of -0.53%, the company may face hurdles in achieving optimal financial performance.
Debt Management: Holley's debt-to-equity ratio stands notably higher than the industry average, reaching 1.22. This indicates a heavier reliance on borrowed funds, raising concerns about financial leverage.
Analyst Ratings: Simplified
Analysts are specialists within banking and financial systems that typically report for specific stocks or within defined sectors. These people research company financial statements, sit in conference calls and meetings, and speak with relevant insiders to determine what are known as analyst ratings for stocks. Typically, analysts will rate each stock once a quarter.
Some analysts will also offer forecasts for metrics like growth estimates, earnings, and revenue to provide further guidance on stocks. Investors who use analyst ratings should note that this specialized advice comes from humans and may be subject to error.
Breaking: Wall Street's Next Big Mover
Benzinga's #1 analyst just identified a stock poised for explosive growth. This under-the-radar company could surge 200%+ as major market shifts unfold. Click here for urgent details.
This article was generated by Benzinga's automated content engine and reviewed by an editor.
Edge Rankings
Price Trend
© 2025 Benzinga.com. Benzinga does not provide investment advice. All rights reserved.
date | ticker | name | Price Target | Upside/Downside | Recommendation | Firm |
|---|
Trade confidently with insights and alerts from analyst ratings, free reports and breaking news that affects the stocks you care about.

