


Analysts' ratings for BXP BXP over the last quarter vary from bullish to bearish, as provided by 7 analysts.
The table below provides a concise overview of recent ratings by analysts, offering insights into the changing sentiments over the past 30 days and drawing comparisons with the preceding months for a holistic perspective.
| Bullish | Somewhat Bullish | Indifferent | Somewhat Bearish | Bearish | |
|---|---|---|---|---|---|
| Total Ratings | 1 | 3 | 2 | 1 | 0 |
| Last 30D | 0 | 0 | 1 | 0 | 0 |
| 1M Ago | 0 | 0 | 1 | 0 | 0 |
| 2M Ago | 0 | 2 | 0 | 0 | 0 |
| 3M Ago | 1 | 1 | 0 | 1 | 0 |
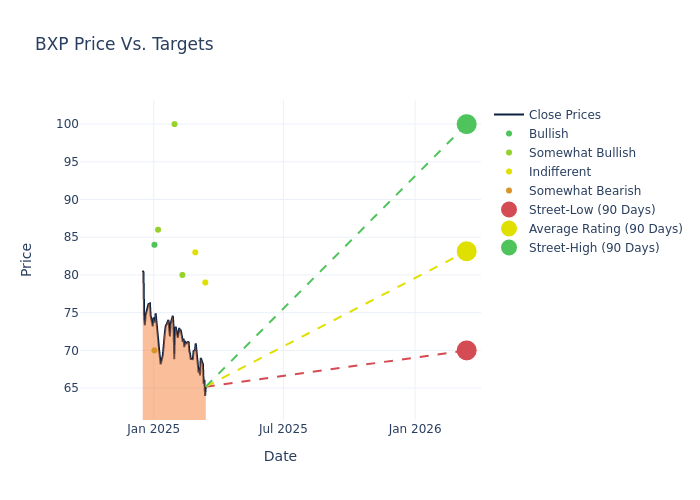
In the assessment of 12-month price targets, analysts unveil insights for BXP, presenting an average target of $83.14, a high estimate of $100.00, and a low estimate of $70.00. A decline of 8.06% from the prior average price target is evident in the current average.
Exploring Analyst Ratings: An In-Depth Overview
In examining recent analyst actions, we gain insights into how financial experts perceive BXP. The following summary outlines key analysts, their recent evaluations, and adjustments to ratings and price targets.
| Analyst | Analyst Firm | Action Taken | Rating | Current Price Target | Prior Price Target |
|---|---|---|---|---|---|
| Anthony Powell | Barclays | Lowers | Equal-Weight | $79.00 | $89.00 |
| Nicholas Yulico | Scotiabank | Lowers | Sector Perform | $83.00 | $85.00 |
| Blaine Heck | Wells Fargo | Lowers | Overweight | $80.00 | $88.00 |
| Alexander Goldfarb | Piper Sandler | Lowers | Overweight | $100.00 | $105.00 |
| Vikram Malhotra | Mizuho | Lowers | Outperform | $86.00 | $92.00 |
| Richard Anderson | Wedbush | Lowers | Underperform | $70.00 | $81.00 |
| Peter Abramowitz | Jefferies | Lowers | Buy | $84.00 | $93.00 |
Key Insights:
- Action Taken: In response to dynamic market conditions and company performance, analysts update their recommendations. Whether they 'Maintain', 'Raise', or 'Lower' their stance, it signifies their reaction to recent developments related to BXP. This insight gives a snapshot of analysts' perspectives on the current state of the company.
- Rating: Delving into assessments, analysts assign qualitative values, from 'Outperform' to 'Underperform'. These ratings communicate expectations for the relative performance of BXP compared to the broader market.
- Price Targets: Analysts explore the dynamics of price targets, providing estimates for the future value of BXP's stock. This examination reveals shifts in analysts' expectations over time.
Considering these analyst evaluations in conjunction with other financial indicators can offer a comprehensive understanding of BXP's market position. Stay informed and make well-informed decisions with our Ratings Table.
Stay up to date on BXP analyst ratings.
Get to Know BXP Better
BXP Inc. owns over 180 properties consisting of approximately 53 million rentable square feet of space. The portfolio is dominated by office buildings and is spread across major cities such as New York, Boston, San Francisco, Los Angeles, Seattle, and the Washington, D.C., region. The real estate investment trust also owns limited retail, hotel, and residential properties.
BXP: A Financial Overview
Market Capitalization: Boasting an elevated market capitalization, the company surpasses industry averages. This signals substantial size and strong market recognition.
Revenue Growth: BXP's remarkable performance in 3 months is evident. As of 31 December, 2024, the company achieved an impressive revenue growth rate of 3.58%. This signifies a substantial increase in the company's top-line earnings. In comparison to its industry peers, the company stands out with a growth rate higher than the average among peers in the Real Estate sector.
Net Margin: BXP's net margin lags behind industry averages, suggesting challenges in maintaining strong profitability. With a net margin of -26.66%, the company may face hurdles in effective cost management.
Return on Equity (ROE): BXP's ROE is below industry standards, pointing towards difficulties in efficiently utilizing equity capital. With an ROE of -4.1%, the company may encounter challenges in delivering satisfactory returns for shareholders.
Return on Assets (ROA): BXP's ROA is below industry averages, indicating potential challenges in efficiently utilizing assets. With an ROA of -0.87%, the company may face hurdles in achieving optimal financial returns.
Debt Management: BXP's debt-to-equity ratio stands notably higher than the industry average, reaching 3.14. This indicates a heavier reliance on borrowed funds, raising concerns about financial leverage.
How Are Analyst Ratings Determined?
Analyst ratings serve as essential indicators of stock performance, provided by experts in banking and financial systems. These specialists diligently analyze company financial statements, participate in conference calls, and engage with insiders to generate quarterly ratings for individual stocks.
Some analysts publish their predictions for metrics such as growth estimates, earnings, and revenue to provide additional guidance with their ratings. When using analyst ratings, it is important to keep in mind that stock and sector analysts are also human and are only offering their opinions to investors.
Which Stocks Are Analysts Recommending Now?
Benzinga Edge gives you instant access to all major analyst upgrades, downgrades, and price targets. Sort by accuracy, upside potential, and more. Click here to stay ahead of the market.
This article was generated by Benzinga's automated content engine and reviewed by an editor.
Edge Rankings
Price Trend
© 2025 Benzinga.com. Benzinga does not provide investment advice. All rights reserved.
date | ticker | name | Price Target | Upside/Downside | Recommendation | Firm |
|---|
Trade confidently with insights and alerts from analyst ratings, free reports and breaking news that affects the stocks you care about.

