


9 analysts have shared their evaluations of Clean Harbors CLH during the recent three months, expressing a mix of bullish and bearish perspectives.
The table below offers a condensed view of their recent ratings, showcasing the changing sentiments over the past 30 days and comparing them to the preceding months.
| Bullish | Somewhat Bullish | Indifferent | Somewhat Bearish | Bearish | |
|---|---|---|---|---|---|
| Total Ratings | 4 | 4 | 1 | 0 | 0 |
| Last 30D | 0 | 0 | 1 | 0 | 0 |
| 1M Ago | 3 | 3 | 0 | 0 | 0 |
| 2M Ago | 0 | 0 | 0 | 0 | 0 |
| 3M Ago | 1 | 1 | 0 | 0 | 0 |
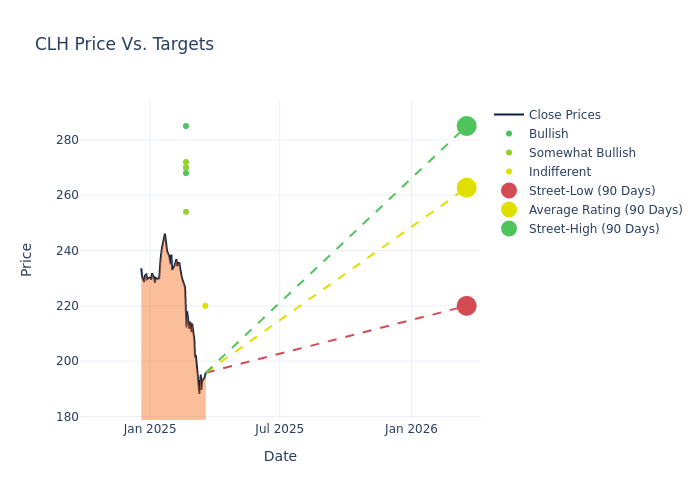
Analysts have set 12-month price targets for Clean Harbors, revealing an average target of $262.56, a high estimate of $285.00, and a low estimate of $220.00. This current average represents a 3.0% decrease from the previous average price target of $270.67.
Deciphering Analyst Ratings: An In-Depth Analysis
The analysis of recent analyst actions sheds light on the perception of Clean Harbors by financial experts. The following summary presents key analysts, their recent evaluations, and adjustments to ratings and price targets.
| Analyst | Analyst Firm | Action Taken | Rating | Current Price Target | Prior Price Target |
|---|---|---|---|---|---|
| Jerry Revich | Goldman Sachs | Lowers | Neutral | $220.00 | $250.00 |
| Michael Hoffman | Stifel | Lowers | Buy | $285.00 | $290.00 |
| Noah Kaye | Oppenheimer | Lowers | Outperform | $254.00 | $256.00 |
| Tobey Sommer | Truist Securities | Lowers | Buy | $270.00 | $280.00 |
| Devin Dodge | BMO Capital | Lowers | Outperform | $270.00 | $284.00 |
| David Manthey | Baird | Lowers | Outperform | $272.00 | $285.00 |
| James Ricchiuti | Needham | Maintains | Buy | $268.00 | $268.00 |
| James Ricchiuti | Needham | Maintains | Buy | $268.00 | $268.00 |
| Noah Kaye | Oppenheimer | Raises | Outperform | $256.00 | $255.00 |
Key Insights:
- Action Taken: Analysts frequently update their recommendations based on evolving market conditions and company performance. Whether they 'Maintain', 'Raise' or 'Lower' their stance, it reflects their reaction to recent developments related to Clean Harbors. This information provides a snapshot of how analysts perceive the current state of the company.
- Rating: Providing a comprehensive analysis, analysts offer qualitative assessments, ranging from 'Outperform' to 'Underperform'. These ratings reflect expectations for the relative performance of Clean Harbors compared to the broader market.
- Price Targets: Delving into movements, analysts provide estimates for the future value of Clean Harbors's stock. This analysis reveals shifts in analysts' expectations over time.
Navigating through these analyst evaluations alongside other financial indicators can contribute to a holistic understanding of Clean Harbors's market standing. Stay informed and make data-driven decisions with our Ratings Table.
Stay up to date on Clean Harbors analyst ratings.
About Clean Harbors
Clean Harbors Inc is an environmental and industrial services provider. It provides parts cleaning and related environmental services to commercial, industrial, and automotive customers. Its business segments are Environmental Services and Safety-Kleen Sustainability Solutions. The company generates the majority of its revenues from the Environmental Services segment.
Clean Harbors's Financial Performance
Market Capitalization Analysis: The company's market capitalization is below the industry average, suggesting that it is relatively smaller compared to peers. This could be due to various factors, including perceived growth potential or operational scale.
Revenue Growth: Clean Harbors displayed positive results in 3 months. As of 31 December, 2024, the company achieved a solid revenue growth rate of approximately 6.95%. This indicates a notable increase in the company's top-line earnings. As compared to its peers, the company achieved a growth rate higher than the average among peers in Industrials sector.
Net Margin: Clean Harbors's financial strength is reflected in its exceptional net margin, which exceeds industry averages. With a remarkable net margin of 5.87%, the company showcases strong profitability and effective cost management.
Return on Equity (ROE): Clean Harbors's financial strength is reflected in its exceptional ROE, which exceeds industry averages. With a remarkable ROE of 3.29%, the company showcases efficient use of equity capital and strong financial health.
Return on Assets (ROA): Clean Harbors's ROA surpasses industry standards, highlighting the company's exceptional financial performance. With an impressive 1.14% ROA, the company effectively utilizes its assets for optimal returns.
Debt Management: The company maintains a balanced debt approach with a debt-to-equity ratio below industry norms, standing at 1.18.
Analyst Ratings: What Are They?
Benzinga tracks 150 analyst firms and reports on their stock expectations. Analysts typically arrive at their conclusions by predicting how much money a company will make in the future, usually the upcoming five years, and how risky or predictable that company's revenue streams are.
Analysts attend company conference calls and meetings, research company financial statements, and communicate with insiders to publish their ratings on stocks. Analysts typically rate each stock once per quarter or whenever the company has a major update.
Some analysts publish their predictions for metrics such as growth estimates, earnings, and revenue to provide additional guidance with their ratings. When using analyst ratings, it is important to keep in mind that stock and sector analysts are also human and are only offering their opinions to investors.
If you want to keep track of which analysts are outperforming others, you can view updated analyst ratings along withanalyst success scores in Benzinga Pro.
Which Stocks Are Analysts Recommending Now?
Benzinga Edge gives you instant access to all major analyst upgrades, downgrades, and price targets. Sort by accuracy, upside potential, and more. Click here to stay ahead of the market.
This article was generated by Benzinga's automated content engine and reviewed by an editor.
Edge Rankings
Price Trend
© 2025 Benzinga.com. Benzinga does not provide investment advice. All rights reserved.
date | ticker | name | Price Target | Upside/Downside | Recommendation | Firm |
|---|
Trade confidently with insights and alerts from analyst ratings, free reports and breaking news that affects the stocks you care about.

