


In the preceding three months, 12 analysts have released ratings for Boyd Gaming BYD, presenting a wide array of perspectives from bullish to bearish.
The following table encapsulates their recent ratings, offering a glimpse into the evolving sentiments over the past 30 days and comparing them to the preceding months.
| Bullish | Somewhat Bullish | Indifferent | Somewhat Bearish | Bearish | |
|---|---|---|---|---|---|
| Total Ratings | 3 | 3 | 6 | 0 | 0 |
| Last 30D | 0 | 0 | 0 | 0 | 0 |
| 1M Ago | 0 | 1 | 1 | 0 | 0 |
| 2M Ago | 1 | 2 | 5 | 0 | 0 |
| 3M Ago | 2 | 0 | 0 | 0 | 0 |
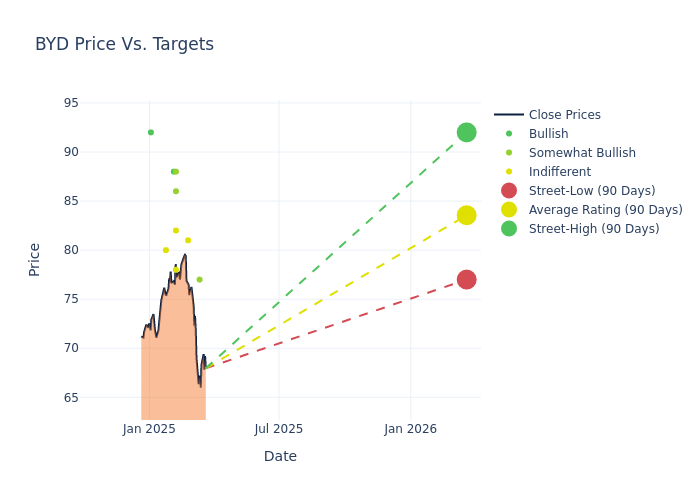
The 12-month price targets assessed by analysts reveal further insights, featuring an average target of $82.33, a high estimate of $92.00, and a low estimate of $74.00. Surpassing the previous average price target of $76.58, the current average has increased by 7.51%.
Deciphering Analyst Ratings: An In-Depth Analysis
The analysis of recent analyst actions sheds light on the perception of Boyd Gaming by financial experts. The following summary presents key analysts, their recent evaluations, and adjustments to ratings and price targets.
| Analyst | Analyst Firm | Action Taken | Rating | Current Price Target | Prior Price Target |
|---|---|---|---|---|---|
| Joseph Stauff | Susquehanna | Lowers | Positive | $77.00 | $79.00 |
| Stephen Grambling | Morgan Stanley | Lowers | Equal-Weight | $81.00 | $82.00 |
| Brandt Montour | Barclays | Raises | Equal-Weight | $78.00 | $74.00 |
| Steven Wieczynski | Stifel | Raises | Hold | $82.00 | $74.00 |
| Daniel Politzer | Wells Fargo | Raises | Overweight | $88.00 | $82.00 |
| Ben Chaiken | Mizuho | Raises | Outperform | $86.00 | $79.00 |
| Barry Jonas | Truist Securities | Raises | Buy | $88.00 | $85.00 |
| Joseph Stauff | Susquehanna | Raises | Neutral | $77.00 | $69.00 |
| Joseph Greff | JP Morgan | Raises | Neutral | $80.00 | $74.00 |
| Brandt Montour | Barclays | Raises | Equal-Weight | $74.00 | $71.00 |
| Barry Jonas | Truist Securities | Raises | Buy | $85.00 | $77.00 |
| David Katz | Jefferies | Raises | Buy | $92.00 | $73.00 |
Key Insights:
- Action Taken: Responding to changing market dynamics and company performance, analysts update their recommendations. Whether they 'Maintain', 'Raise', or 'Lower' their stance, it signifies their response to recent developments related to Boyd Gaming. This offers insight into analysts' perspectives on the current state of the company.
- Rating: Analysts unravel qualitative evaluations for stocks, ranging from 'Outperform' to 'Underperform'. These ratings offer insights into expectations for the relative performance of Boyd Gaming compared to the broader market.
- Price Targets: Analysts set price targets as an estimate of a stock's future value. Comparing the current and prior price targets provides insight into how analysts' expectations have changed over time. This information can be valuable for investors seeking to understand consensus views on the stock's potential future performance.
Navigating through these analyst evaluations alongside other financial indicators can contribute to a holistic understanding of Boyd Gaming's market standing. Stay informed and make data-driven decisions with our Ratings Table.
Stay up to date on Boyd Gaming analyst ratings.
About Boyd Gaming
Boyd Gaming Corp is a multi-jurisdictional gaming company. The company operates wholly-owned gaming entertainment properties (casino space, slot machines, table games, and hotel rooms) in Nevada, Illinois, Indiana, Iowa, Kansas, Louisiana, Mississippi, Missouri, Ohio, and Pennsylvania. Geographical regions separate its business segments: Las Vegas Locals, Downtown Las Vegas, Midwest and South, and Online. Midwest and South hold the key number of entertainment properties, and it generate the majority of sales for the company.
Breaking Down Boyd Gaming's Financial Performance
Market Capitalization Analysis: Above industry benchmarks, the company's market capitalization emphasizes a noteworthy size, indicative of a strong market presence.
Revenue Growth: Over the 3 months period, Boyd Gaming showcased positive performance, achieving a revenue growth rate of 9.06% as of 31 December, 2024. This reflects a substantial increase in the company's top-line earnings. In comparison to its industry peers, the company stands out with a growth rate higher than the average among peers in the Consumer Discretionary sector.
Net Margin: The company's net margin is a standout performer, exceeding industry averages. With an impressive net margin of 16.38%, the company showcases strong profitability and effective cost control.
Return on Equity (ROE): Boyd Gaming's ROE stands out, surpassing industry averages. With an impressive ROE of 10.61%, the company demonstrates effective use of equity capital and strong financial performance.
Return on Assets (ROA): The company's ROA is a standout performer, exceeding industry averages. With an impressive ROA of 2.69%, the company showcases effective utilization of assets.
Debt Management: With a below-average debt-to-equity ratio of 2.49, Boyd Gaming adopts a prudent financial strategy, indicating a balanced approach to debt management.
What Are Analyst Ratings?
Analysts work in banking and financial systems and typically specialize in reporting for stocks or defined sectors. Analysts may attend company conference calls and meetings, research company financial statements, and communicate with insiders to publish "analyst ratings" for stocks. Analysts typically rate each stock once per quarter.
Some analysts also offer predictions for helpful metrics such as earnings, revenue, and growth estimates to provide further guidance as to what to do with certain tickers. It is important to keep in mind that while stock and sector analysts are specialists, they are also human and can only forecast their beliefs to traders.
Which Stocks Are Analysts Recommending Now?
Benzinga Edge gives you instant access to all major analyst upgrades, downgrades, and price targets. Sort by accuracy, upside potential, and more. Click here to stay ahead of the market.
This article was generated by Benzinga's automated content engine and reviewed by an editor.
Edge Rankings
Price Trend
© 2025 Benzinga.com. Benzinga does not provide investment advice. All rights reserved.
date | ticker | name | Price Target | Upside/Downside | Recommendation | Firm |
|---|
Trade confidently with insights and alerts from analyst ratings, free reports and breaking news that affects the stocks you care about.

