


Ratings for Bloomin Brands BLMN were provided by 8 analysts in the past three months, showcasing a mix of bullish and bearish perspectives.
The following table summarizes their recent ratings, shedding light on the changing sentiments within the past 30 days and comparing them to the preceding months.
| Bullish | Somewhat Bullish | Indifferent | Somewhat Bearish | Bearish | |
|---|---|---|---|---|---|
| Total Ratings | 0 | 0 | 6 | 1 | 1 |
| Last 30D | 0 | 0 | 1 | 0 | 0 |
| 1M Ago | 0 | 0 | 3 | 0 | 1 |
| 2M Ago | 0 | 0 | 0 | 1 | 0 |
| 3M Ago | 0 | 0 | 2 | 0 | 0 |
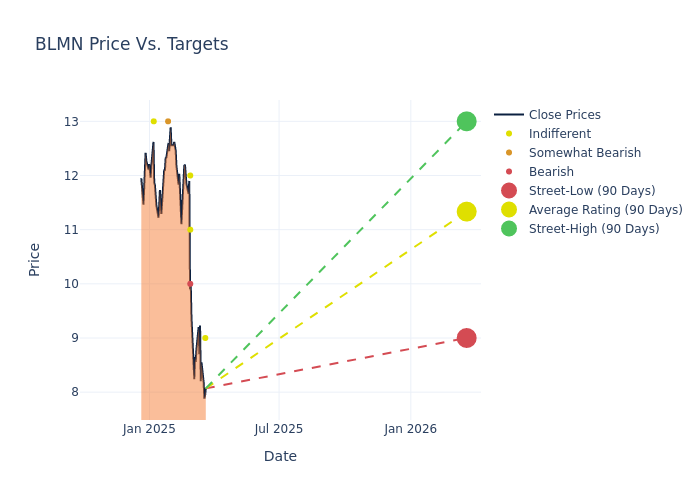
Insights from analysts' 12-month price targets are revealed, presenting an average target of $11.38, a high estimate of $13.00, and a low estimate of $9.00. Highlighting a 22.85% decrease, the current average has fallen from the previous average price target of $14.75.
Exploring Analyst Ratings: An In-Depth Overview
An in-depth analysis of recent analyst actions unveils how financial experts perceive Bloomin Brands. The following summary outlines key analysts, their recent evaluations, and adjustments to ratings and price targets.
| Analyst | Analyst Firm | Action Taken | Rating | Current Price Target | Prior Price Target |
|---|---|---|---|---|---|
| John Ivankoe | JP Morgan | Lowers | Neutral | $9.00 | $10.00 |
| John Ivankoe | JP Morgan | Lowers | Neutral | $10.00 | $13.00 |
| Christine Cho | Goldman Sachs | Lowers | Sell | $10.00 | $13.00 |
| Andrew Strelzik | BMO Capital | Lowers | Market Perform | $12.00 | $16.00 |
| Jeffrey Bernstein | Barclays | Lowers | Equal-Weight | $11.00 | $13.00 |
| Justin Post | B of A Securities | Lowers | Underperform | $13.00 | $18.00 |
| Dennis Geiger | UBS | Lowers | Neutral | $13.00 | $16.00 |
| Jeffrey Bernstein | Barclays | Lowers | Equal-Weight | $13.00 | $19.00 |
Key Insights:
- Action Taken: In response to dynamic market conditions and company performance, analysts update their recommendations. Whether they 'Maintain', 'Raise', or 'Lower' their stance, it signifies their reaction to recent developments related to Bloomin Brands. This insight gives a snapshot of analysts' perspectives on the current state of the company.
- Rating: Gaining insights, analysts provide qualitative assessments, ranging from 'Outperform' to 'Underperform'. These ratings reflect expectations for the relative performance of Bloomin Brands compared to the broader market.
- Price Targets: Analysts predict movements in price targets, offering estimates for Bloomin Brands's future value. Examining the current and prior targets offers insights into analysts' evolving expectations.
Assessing these analyst evaluations alongside crucial financial indicators can provide a comprehensive overview of Bloomin Brands's market position. Stay informed and make well-judged decisions with the assistance of our Ratings Table.
Stay up to date on Bloomin Brands analyst ratings.
If you are interested in following small-cap stock news and performance you can start by tracking it here.
Delving into Bloomin Brands's Background
Bloomin Brands Inc operates as a casual dining restaurant company. The company's brand includes Outback Steakhouse, Carrabba's Italian Grill, Bonefish Grill, and Fleming's Prime Steakhouse and Wine Bar. The company owns and operates its restaurants, and the remainder is franchised. It derives revenue mainly from the United States, but the company has a presence in Brazil and South Korea with company-owned Outbacks and Carrabbas. In addition, it also has exposure to several countries, predominantly in Asia, principally through franchising. The Company aggregates its operating segments into two reportable segments, U.S. and international. The U.S. segment includes all restaurants operating in the U.S. while restaurants operating outside the U.S. are included in the international segment.
Financial Insights: Bloomin Brands
Market Capitalization Analysis: The company's market capitalization is below the industry average, suggesting that it is relatively smaller compared to peers. This could be due to various factors, including perceived growth potential or operational scale.
Decline in Revenue: Over the 3 months period, Bloomin Brands faced challenges, resulting in a decline of approximately -13.52% in revenue growth as of 31 December, 2024. This signifies a reduction in the company's top-line earnings. As compared to competitors, the company encountered difficulties, with a growth rate lower than the average among peers in the Consumer Discretionary sector.
Net Margin: Bloomin Brands's net margin excels beyond industry benchmarks, reaching -13.3%. This signifies efficient cost management and strong financial health.
Return on Equity (ROE): Bloomin Brands's ROE is below industry averages, indicating potential challenges in efficiently utilizing equity capital. With an ROE of -42.08%, the company may face hurdles in achieving optimal financial returns.
Return on Assets (ROA): Bloomin Brands's ROA is below industry standards, pointing towards difficulties in efficiently utilizing assets. With an ROA of -2.33%, the company may encounter challenges in delivering satisfactory returns from its assets.
Debt Management: Bloomin Brands's debt-to-equity ratio is notably higher than the industry average. With a ratio of 16.79, the company relies more heavily on borrowed funds, indicating a higher level of financial risk.
What Are Analyst Ratings?
Ratings come from analysts, or specialists within banking and financial systems that report for specific stocks or defined sectors (typically once per quarter for each stock). Analysts usually derive their information from company conference calls and meetings, financial statements, and conversations with important insiders to reach their decisions.
Beyond their standard evaluations, some analysts contribute predictions for metrics like growth estimates, earnings, and revenue, furnishing investors with additional guidance. Users of analyst ratings should be mindful that this specialized advice is shaped by human perspectives and may be subject to variability.
Which Stocks Are Analysts Recommending Now?
Benzinga Edge gives you instant access to all major analyst upgrades, downgrades, and price targets. Sort by accuracy, upside potential, and more. Click here to stay ahead of the market.
This article was generated by Benzinga's automated content engine and reviewed by an editor.
Edge Rankings
Price Trend
© 2025 Benzinga.com. Benzinga does not provide investment advice. All rights reserved.
date | ticker | name | Price Target | Upside/Downside | Recommendation | Firm |
|---|
Trade confidently with insights and alerts from analyst ratings, free reports and breaking news that affects the stocks you care about.

