


In the last three months, 14 analysts have published ratings on Texas Roadhouse TXRH, offering a diverse range of perspectives from bullish to bearish.
The table below provides a snapshot of their recent ratings, showcasing how sentiments have evolved over the past 30 days and comparing them to the preceding months.
| Bullish | Somewhat Bullish | Indifferent | Somewhat Bearish | Bearish | |
|---|---|---|---|---|---|
| Total Ratings | 4 | 2 | 8 | 0 | 0 |
| Last 30D | 0 | 0 | 1 | 0 | 0 |
| 1M Ago | 3 | 1 | 4 | 0 | 0 |
| 2M Ago | 0 | 1 | 1 | 0 | 0 |
| 3M Ago | 1 | 0 | 2 | 0 | 0 |
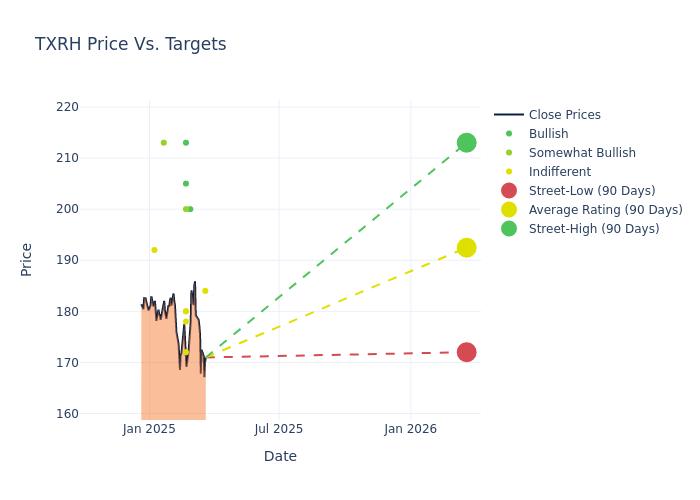
Insights from analysts' 12-month price targets are revealed, presenting an average target of $193.64, a high estimate of $213.00, and a low estimate of $172.00. Experiencing a 3.29% decline, the current average is now lower than the previous average price target of $200.23.
Deciphering Analyst Ratings: An In-Depth Analysis
In examining recent analyst actions, we gain insights into how financial experts perceive Texas Roadhouse. The following summary outlines key analysts, their recent evaluations, and adjustments to ratings and price targets.
| Analyst | Analyst Firm | Action Taken | Rating | Current Price Target | Prior Price Target |
|---|---|---|---|---|---|
| John Ivankoe | JP Morgan | Lowers | Neutral | $184.00 | $185.00 |
| Gregory Francfort | Guggenheim | Lowers | Buy | $200.00 | $205.00 |
| Jim Salera | Stephens & Co. | Lowers | Equal-Weight | $180.00 | $186.00 |
| Logan Reich | RBC Capital | Lowers | Sector Perform | $180.00 | $200.00 |
| Jon Tower | Citigroup | Raises | Buy | $213.00 | $212.00 |
| Jake Bartlett | Truist Securities | Lowers | Buy | $205.00 | $209.00 |
| Chris O'Cull | Stifel | Lowers | Hold | $172.00 | $185.00 |
| Nick Setyan | Wedbush | Lowers | Outperform | $200.00 | $220.00 |
| Jeffrey Bernstein | Barclays | Lowers | Equal-Weight | $178.00 | $194.00 |
| Chris O'Cull | Stifel | Lowers | Hold | $185.00 | $195.00 |
| John Glass | Morgan Stanley | Raises | Overweight | $213.00 | $205.00 |
| Logan Reich | RBC Capital | Maintains | Sector Perform | $200.00 | $200.00 |
| Jeff Farmer | Gordon Haskett | Announces | Hold | $192.00 | - |
| Jake Bartlett | Truist Securities | Raises | Buy | $209.00 | $207.00 |
Key Insights:
- Action Taken: Analysts adapt their recommendations to changing market conditions and company performance. Whether they 'Maintain', 'Raise' or 'Lower' their stance, it reflects their response to recent developments related to Texas Roadhouse. This information provides a snapshot of how analysts perceive the current state of the company.
- Rating: Offering a comprehensive view, analysts assess stocks qualitatively, spanning from 'Outperform' to 'Underperform'. These ratings convey expectations for the relative performance of Texas Roadhouse compared to the broader market.
- Price Targets: Understanding forecasts, analysts offer estimates for Texas Roadhouse's future value. Examining the current and prior targets provides insight into analysts' changing expectations.
Understanding these analyst evaluations alongside key financial indicators can offer valuable insights into Texas Roadhouse's market standing. Stay informed and make well-considered decisions with our Ratings Table.
Stay up to date on Texas Roadhouse analyst ratings.
Get to Know Texas Roadhouse Better
Texas Roadhouse Inc is a restaurant company operating predominately in the casual dining segment. The company manages its restaurant and franchising operations by concept and, as a result, has identified Texas Roadhouse, Bubba's 33, Jaggers, and retail initiatives as separate operating segments. In addition, it has identified Texas Roadhouse and Bubba's 33 as reportable segments. Maximum revenue for the company is generated from the Texas Roahouse segment, which is a moderately priced, full-service, casual dining restaurant concept offering steaks, a selection of ribs, seafood, chicken, pork chops, pulled pork, vegetable plates, and an assortment of hamburgers, salads, and sandwiches.
Texas Roadhouse: Delving into Financials
Market Capitalization Analysis: Below industry benchmarks, the company's market capitalization reflects a smaller scale relative to peers. This could be attributed to factors such as growth expectations or operational capacity.
Revenue Growth: Over the 3 months period, Texas Roadhouse showcased positive performance, achieving a revenue growth rate of 23.49% as of 31 December, 2024. This reflects a substantial increase in the company's top-line earnings. When compared to others in the Consumer Discretionary sector, the company excelled with a growth rate higher than the average among peers.
Net Margin: The company's net margin is a standout performer, exceeding industry averages. With an impressive net margin of 8.06%, the company showcases strong profitability and effective cost control.
Return on Equity (ROE): Texas Roadhouse's ROE is below industry averages, indicating potential challenges in efficiently utilizing equity capital. With an ROE of 8.69%, the company may face hurdles in achieving optimal financial returns.
Return on Assets (ROA): The company's ROA is a standout performer, exceeding industry averages. With an impressive ROA of 3.79%, the company showcases effective utilization of assets.
Debt Management: With a below-average debt-to-equity ratio of 0.63, Texas Roadhouse adopts a prudent financial strategy, indicating a balanced approach to debt management.
How Are Analyst Ratings Determined?
Ratings come from analysts, or specialists within banking and financial systems that report for specific stocks or defined sectors (typically once per quarter for each stock). Analysts usually derive their information from company conference calls and meetings, financial statements, and conversations with important insiders to reach their decisions.
In addition to their assessments, some analysts extend their insights by offering predictions for key metrics such as earnings, revenue, and growth estimates. This supplementary information provides further guidance for traders. It is crucial to recognize that, despite their specialization, analysts are human and can only provide forecasts based on their beliefs.
Which Stocks Are Analysts Recommending Now?
Benzinga Edge gives you instant access to all major analyst upgrades, downgrades, and price targets. Sort by accuracy, upside potential, and more. Click here to stay ahead of the market.
This article was generated by Benzinga's automated content engine and reviewed by an editor.
Edge Rankings
Price Trend
© 2025 Benzinga.com. Benzinga does not provide investment advice. All rights reserved.
date | ticker | name | Price Target | Upside/Downside | Recommendation | Firm |
|---|
Trade confidently with insights and alerts from analyst ratings, free reports and breaking news that affects the stocks you care about.

