
Amazon.com AMZN has been analyzed by 34 analysts in the last three months, revealing a diverse range of perspectives from bullish to bearish.
The following table summarizes their recent ratings, shedding light on the changing sentiments within the past 30 days and comparing them to the preceding months.
| Bullish | Somewhat Bullish | Indifferent | Somewhat Bearish | Bearish | |
|---|---|---|---|---|---|
| Total Ratings | 14 | 17 | 3 | 0 | 0 |
| Last 30D | 0 | 1 | 0 | 0 | 0 |
| 1M Ago | 0 | 0 | 1 | 0 | 0 |
| 2M Ago | 13 | 12 | 1 | 0 | 0 |
| 3M Ago | 1 | 4 | 1 | 0 | 0 |
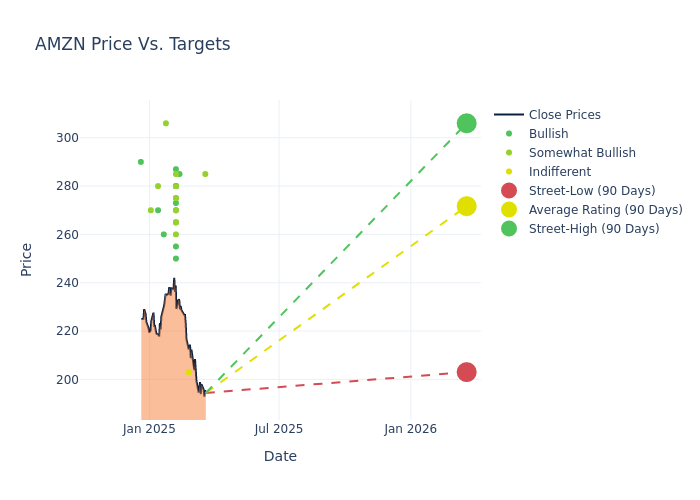
Analysts' evaluations of 12-month price targets offer additional insights, showcasing an average target of $267.15, with a high estimate of $306.00 and a low estimate of $203.00. Surpassing the previous average price target of $250.38, the current average has increased by 6.7%.
Analyzing Analyst Ratings: A Detailed Breakdown
A comprehensive examination of how financial experts perceive Amazon.com is derived from recent analyst actions. The following is a detailed summary of key analysts, their recent evaluations, and adjustments to ratings and price targets.
| Analyst | Analyst Firm | Action Taken | Rating | Current Price Target | Prior Price Target |
|---|---|---|---|---|---|
| Nicholas Jones | Citizens Capital Markets | Maintains | Market Outperform | $285.00 | $285.00 |
| Ken Gawrelski | Wells Fargo | Lowers | Equal-Weight | $203.00 | $207.00 |
| Rob Sanderson | Loop Capital | Raises | Buy | $285.00 | $275.00 |
| Ronald Josey | Citigroup | Lowers | Buy | $273.00 | $275.00 |
| Tom Forte | Maxim Group | Raises | Buy | $280.00 | $260.00 |
| Ross Sandler | Barclays | Raises | Overweight | $265.00 | $235.00 |
| Gil Luria | DA Davidson | Raises | Buy | $280.00 | $235.00 |
| Brad Erickson | RBC Capital | Raises | Outperform | $265.00 | $255.00 |
| Scott Devitt | Wedbush | Maintains | Outperform | $280.00 | $280.00 |
| Michael Graham | Canaccord Genuity | Raises | Buy | $280.00 | $265.00 |
| Deepak Mathivanan | Cantor Fitzgerald | Maintains | Overweight | $270.00 | $270.00 |
| Jason Helfstein | Oppenheimer | Raises | Outperform | $260.00 | $230.00 |
| Daniel Kurnos | Benchmark | Raises | Buy | $270.00 | $265.00 |
| Nicholas Jones | JMP Securities | Maintains | Market Outperform | $285.00 | $285.00 |
| Mark Kelley | Stifel | Raises | Buy | $275.00 | $245.00 |
| Ken Gawrelski | Wells Fargo | Lowers | Equal-Weight | $207.00 | $212.00 |
| Thomas Champion | Piper Sandler | Raises | Overweight | $265.00 | $225.00 |
| Barton Crockett | Rosenblatt | Raises | Buy | $287.00 | $236.00 |
| Laura Martin | Needham | Maintains | Buy | $250.00 | $250.00 |
| Joseph Feldman | Telsey Advisory Group | Maintains | Outperform | $275.00 | $275.00 |
| Eric Sheridan | Goldman Sachs | Raises | Buy | $255.00 | $240.00 |
| Daniel Kurnos | Benchmark | Raises | Buy | $265.00 | $215.00 |
| Joseph Feldman | Telsey Advisory Group | Maintains | Outperform | $275.00 | $275.00 |
| Nicholas Jones | JMP Securities | Maintains | Market Outperform | $285.00 | $285.00 |
| Nat Schindler | Scotiabank | Raises | Sector Outperform | $306.00 | $246.00 |
| Deepak Mathivanan | Cantor Fitzgerald | Maintains | Overweight | $270.00 | $270.00 |
| Josh Beck | Raymond James | Raises | Strong Buy | $260.00 | $230.00 |
| Laura Martin | Needham | Maintains | Buy | $250.00 | $250.00 |
| Ken Gawrelski | Wells Fargo | Raises | Equal-Weight | $212.00 | $197.00 |
| Christopher Johnen | HSBC | Raises | Buy | $270.00 | $225.00 |
| Brian Nowak | Morgan Stanley | Raises | Overweight | $280.00 | $230.00 |
| Nicholas Jones | JMP Securities | Maintains | Market Outperform | $285.00 | $285.00 |
| Scott Devitt | Wedbush | Raises | Outperform | $260.00 | $250.00 |
| Shweta Khajuria | Wolfe Research | Raises | Outperform | $270.00 | $250.00 |
Key Insights:
- Action Taken: In response to dynamic market conditions and company performance, analysts update their recommendations. Whether they 'Maintain', 'Raise', or 'Lower' their stance, it signifies their reaction to recent developments related to Amazon.com. This insight gives a snapshot of analysts' perspectives on the current state of the company.
- Rating: Offering insights into predictions, analysts assign qualitative values, from 'Outperform' to 'Underperform'. These ratings convey expectations for the relative performance of Amazon.com compared to the broader market.
- Price Targets: Analysts explore the dynamics of price targets, providing estimates for the future value of Amazon.com's stock. This examination reveals shifts in analysts' expectations over time.
Understanding these analyst evaluations alongside key financial indicators can offer valuable insights into Amazon.com's market standing. Stay informed and make well-considered decisions with our Ratings Table.
Stay up to date on Amazon.com analyst ratings.
Discovering Amazon.com: A Closer Look
Amazon is the leading online retailer and marketplace for third party sellers. Retail related revenue represents approximately 75% of total, followed by Amazon Web Services' cloud computing, storage, database, and other offerings (15%), advertising services (5% to 10%), and other the remainder. International segments constitute 25% to 30% of Amazon's non-AWS sales, led by Germany, the United Kingdom, and Japan.
A Deep Dive into Amazon.com's Financials
Market Capitalization Highlights: Above the industry average, the company's market capitalization signifies a significant scale, indicating strong confidence and market prominence.
Revenue Growth: Amazon.com's revenue growth over a period of 3 months has been noteworthy. As of 31 December, 2024, the company achieved a revenue growth rate of approximately 10.49%. This indicates a substantial increase in the company's top-line earnings. As compared to its peers, the revenue growth lags behind its industry peers. The company achieved a growth rate lower than the average among peers in Consumer Discretionary sector.
Net Margin: Amazon.com's net margin surpasses industry standards, highlighting the company's exceptional financial performance. With an impressive 10.65% net margin, the company effectively manages costs and achieves strong profitability.
Return on Equity (ROE): The company's ROE is a standout performer, exceeding industry averages. With an impressive ROE of 7.34%, the company showcases effective utilization of equity capital.
Return on Assets (ROA): Amazon.com's ROA surpasses industry standards, highlighting the company's exceptional financial performance. With an impressive 3.31% ROA, the company effectively utilizes its assets for optimal returns.
Debt Management: Amazon.com's debt-to-equity ratio is below the industry average. With a ratio of 0.46, the company relies less on debt financing, maintaining a healthier balance between debt and equity, which can be viewed positively by investors.
Understanding the Relevance of Analyst Ratings
Benzinga tracks 150 analyst firms and reports on their stock expectations. Analysts typically arrive at their conclusions by predicting how much money a company will make in the future, usually the upcoming five years, and how risky or predictable that company's revenue streams are.
Analysts attend company conference calls and meetings, research company financial statements, and communicate with insiders to publish their ratings on stocks. Analysts typically rate each stock once per quarter or whenever the company has a major update.
Analysts may supplement their ratings with predictions for metrics like growth estimates, earnings, and revenue, offering investors a more comprehensive outlook. However, investors should be mindful that analysts, like any human, can have subjective perspectives influencing their forecasts.
Which Stocks Are Analysts Recommending Now?
Benzinga Edge gives you instant access to all major analyst upgrades, downgrades, and price targets. Sort by accuracy, upside potential, and more. Click here to stay ahead of the market.
This article was generated by Benzinga's automated content engine and reviewed by an editor.
Edge Rankings
Price Trend
© 2025 Benzinga.com. Benzinga does not provide investment advice. All rights reserved.
date | ticker | name | Price Target | Upside/Downside | Recommendation | Firm |
|---|
Trade confidently with insights and alerts from analyst ratings, free reports and breaking news that affects the stocks you care about.

