
4 analysts have shared their evaluations of TPG TPG during the recent three months, expressing a mix of bullish and bearish perspectives.
The following table provides a quick overview of their recent ratings, highlighting the changing sentiments over the past 30 days and comparing them to the preceding months.
| Bullish | Somewhat Bullish | Indifferent | Somewhat Bearish | Bearish | |
|---|---|---|---|---|---|
| Total Ratings | 0 | 2 | 2 | 0 | 0 |
| Last 30D | 0 | 1 | 0 | 0 | 0 |
| 1M Ago | 0 | 0 | 0 | 0 | 0 |
| 2M Ago | 0 | 0 | 1 | 0 | 0 |
| 3M Ago | 0 | 1 | 1 | 0 | 0 |
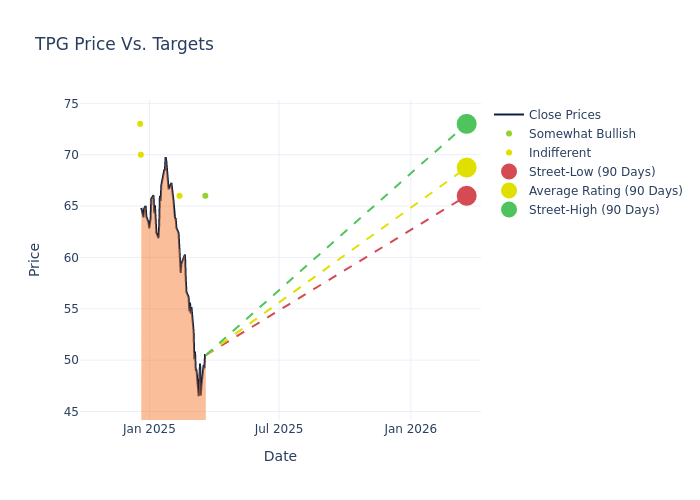
Insights from analysts' 12-month price targets are revealed, presenting an average target of $68.75, a high estimate of $78.00, and a low estimate of $65.00. Observing a downward trend, the current average is 3.85% lower than the prior average price target of $71.50.
Analyzing Analyst Ratings: A Detailed Breakdown
In examining recent analyst actions, we gain insights into how financial experts perceive TPG. The following summary outlines key analysts, their recent evaluations, and adjustments to ratings and price targets.
| Analyst | Analyst Firm | Action Taken | Rating | Current Price Target | Prior Price Target |
|---|---|---|---|---|---|
| Michael Brown | Wells Fargo | Lowers | Overweight | $66.00 | $78.00 |
| Glenn Schorr | Evercore ISI Group | Raises | In-Line | $66.00 | $65.00 |
| Glenn Schorr | Evercore ISI Group | Raises | In-Line | $65.00 | $60.00 |
| Michael Brown | Wells Fargo | Lowers | Overweight | $78.00 | $83.00 |
Key Insights:
- Action Taken: Responding to changing market dynamics and company performance, analysts update their recommendations. Whether they 'Maintain', 'Raise', or 'Lower' their stance, it signifies their response to recent developments related to TPG. This offers insight into analysts' perspectives on the current state of the company.
- Rating: Gaining insights, analysts provide qualitative assessments, ranging from 'Outperform' to 'Underperform'. These ratings reflect expectations for the relative performance of TPG compared to the broader market.
- Price Targets: Analysts provide insights into price targets, offering estimates for the future value of TPG's stock. This comparison reveals trends in analysts' expectations over time.
Navigating through these analyst evaluations alongside other financial indicators can contribute to a holistic understanding of TPG's market standing. Stay informed and make data-driven decisions with our Ratings Table.
Stay up to date on TPG analyst ratings.
Get to Know TPG Better
TPG Inc is an alternative asset management firm. It invests across five multi-product platforms namely Capital, Growth, Impact, Real Estate, Market Solutions, and TPG Angelo Gordon. The company focuses on large-scale, control-oriented private equity investments.
A Deep Dive into TPG's Financials
Market Capitalization Analysis: The company exhibits a lower market capitalization profile, positioning itself below industry averages. This suggests a smaller scale relative to peers.
Revenue Growth: TPG's remarkable performance in 3 months is evident. As of 31 December, 2024, the company achieved an impressive revenue growth rate of 9.63%. This signifies a substantial increase in the company's top-line earnings. As compared to its peers, the revenue growth lags behind its industry peers. The company achieved a growth rate lower than the average among peers in Financials sector.
Net Margin: TPG's net margin lags behind industry averages, suggesting challenges in maintaining strong profitability. With a net margin of 3.8%, the company may face hurdles in effective cost management.
Return on Equity (ROE): TPG's ROE falls below industry averages, indicating challenges in efficiently using equity capital. With an ROE of 3.64%, the company may face hurdles in generating optimal returns for shareholders.
Return on Assets (ROA): TPG's ROA is below industry standards, pointing towards difficulties in efficiently utilizing assets. With an ROA of 0.26%, the company may encounter challenges in delivering satisfactory returns from its assets.
Debt Management: TPG's debt-to-equity ratio is notably higher than the industry average. With a ratio of 2.02, the company relies more heavily on borrowed funds, indicating a higher level of financial risk.
Analyst Ratings: Simplified
Benzinga tracks 150 analyst firms and reports on their stock expectations. Analysts typically arrive at their conclusions by predicting how much money a company will make in the future, usually the upcoming five years, and how risky or predictable that company's revenue streams are.
Analysts attend company conference calls and meetings, research company financial statements, and communicate with insiders to publish their ratings on stocks. Analysts typically rate each stock once per quarter or whenever the company has a major update.
Analysts may supplement their ratings with predictions for metrics like growth estimates, earnings, and revenue, offering investors a more comprehensive outlook. However, investors should be mindful that analysts, like any human, can have subjective perspectives influencing their forecasts.
Which Stocks Are Analysts Recommending Now?
Benzinga Edge gives you instant access to all major analyst upgrades, downgrades, and price targets. Sort by accuracy, upside potential, and more. Click here to stay ahead of the market.
This article was generated by Benzinga's automated content engine and reviewed by an editor.
Edge Rankings
Price Trend
© 2025 Benzinga.com. Benzinga does not provide investment advice. All rights reserved.
date | ticker | name | Price Target | Upside/Downside | Recommendation | Firm |
|---|
Trade confidently with insights and alerts from analyst ratings, free reports and breaking news that affects the stocks you care about.

