


Throughout the last three months, 13 analysts have evaluated Stryker SYK, offering a diverse set of opinions from bullish to bearish.
The following table encapsulates their recent ratings, offering a glimpse into the evolving sentiments over the past 30 days and comparing them to the preceding months.
| Bullish | Somewhat Bullish | Indifferent | Somewhat Bearish | Bearish | |
|---|---|---|---|---|---|
| Total Ratings | 6 | 5 | 2 | 0 | 0 |
| Last 30D | 1 | 0 | 0 | 0 | 0 |
| 1M Ago | 1 | 0 | 0 | 0 | 0 |
| 2M Ago | 3 | 4 | 2 | 0 | 0 |
| 3M Ago | 1 | 1 | 0 | 0 | 0 |
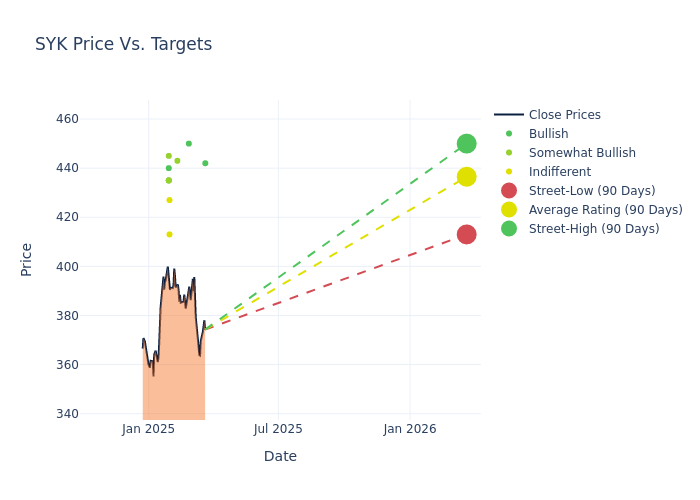
The 12-month price targets, analyzed by analysts, offer insights with an average target of $436.46, a high estimate of $450.00, and a low estimate of $413.00. Marking an increase of 3.63%, the current average surpasses the previous average price target of $421.17.
Investigating Analyst Ratings: An Elaborate Study
A clear picture of Stryker's perception among financial experts is painted with a thorough analysis of recent analyst actions. The summary below outlines key analysts, their recent evaluations, and adjustments to ratings and price targets.
| Analyst | Analyst Firm | Action Taken | Rating | Current Price Target | Prior Price Target |
|---|---|---|---|---|---|
| Mike Matson | Needham | Maintains | Buy | $442.00 | $442.00 |
| Joanne Wuensch | Citigroup | Announces | Buy | $450.00 | - |
| Matt Miksic | Barclays | Raises | Overweight | $443.00 | $418.00 |
| David Roman | Goldman Sachs | Raises | Neutral | $427.00 | $384.00 |
| Richard Newitter | Truist Securities | Raises | Hold | $413.00 | $409.00 |
| Shagun Singh | RBC Capital | Raises | Outperform | $435.00 | $425.00 |
| Larry Biegelsen | Wells Fargo | Raises | Overweight | $435.00 | $427.00 |
| Robbie Marcus | JP Morgan | Raises | Overweight | $445.00 | $420.00 |
| Rick Wise | Stifel | Raises | Buy | $440.00 | $400.00 |
| Kyle Rose | Canaccord Genuity | Raises | Buy | $435.00 | $420.00 |
| Mike Matson | Needham | Maintains | Buy | $442.00 | $442.00 |
| Shagun Singh | RBC Capital | Maintains | Outperform | $425.00 | $425.00 |
| Mike Matson | Needham | Maintains | Buy | $442.00 | $442.00 |
Key Insights:
- Action Taken: Analysts respond to changes in market conditions and company performance, frequently updating their recommendations. Whether they 'Maintain', 'Raise' or 'Lower' their stance, it reflects their reaction to recent developments related to Stryker. This information offers a snapshot of how analysts perceive the current state of the company.
- Rating: Analysts assign qualitative assessments to stocks, ranging from 'Outperform' to 'Underperform'. These ratings convey the analysts' expectations for the relative performance of Stryker compared to the broader market.
- Price Targets: Delving into movements, analysts provide estimates for the future value of Stryker's stock. This analysis reveals shifts in analysts' expectations over time.
Understanding these analyst evaluations alongside key financial indicators can offer valuable insights into Stryker's market standing. Stay informed and make well-considered decisions with our Ratings Table.
Stay up to date on Stryker analyst ratings.
Discovering Stryker: A Closer Look
Stryker designs, manufactures, and markets an array of medical equipment, instruments, consumable supplies, and implantable devices. The product portfolio includes hip and knee replacements, extremities, endoscopy systems, operating room equipment, embolic coils, hospital beds and gurneys, and orthopedic robotics. Stryker remains one of the three largest competitors in reconstructive orthopedic implants and holds the leadership position in operating room equipment. Roughly one fourth of Stryker's total revenue currently comes from outside the United States.
Stryker: Financial Performance Dissected
Market Capitalization: Surpassing industry standards, the company's market capitalization asserts its dominance in terms of size, suggesting a robust market position.
Positive Revenue Trend: Examining Stryker's financials over 3 months reveals a positive narrative. The company achieved a noteworthy revenue growth rate of 10.68% as of 31 December, 2024, showcasing a substantial increase in top-line earnings. In comparison to its industry peers, the company stands out with a growth rate higher than the average among peers in the Health Care sector.
Net Margin: Stryker's financial strength is reflected in its exceptional net margin, which exceeds industry averages. With a remarkable net margin of 8.48%, the company showcases strong profitability and effective cost management.
Return on Equity (ROE): The company's ROE is a standout performer, exceeding industry averages. With an impressive ROE of 2.68%, the company showcases effective utilization of equity capital.
Return on Assets (ROA): Stryker's ROA is below industry averages, indicating potential challenges in efficiently utilizing assets. With an ROA of 1.26%, the company may face hurdles in achieving optimal financial returns.
Debt Management: Stryker's debt-to-equity ratio is below industry norms, indicating a sound financial structure with a ratio of 0.66.
Understanding the Relevance of Analyst Ratings
Analysts work in banking and financial systems and typically specialize in reporting for stocks or defined sectors. Analysts may attend company conference calls and meetings, research company financial statements, and communicate with insiders to publish "analyst ratings" for stocks. Analysts typically rate each stock once per quarter.
Some analysts publish their predictions for metrics such as growth estimates, earnings, and revenue to provide additional guidance with their ratings. When using analyst ratings, it is important to keep in mind that stock and sector analysts are also human and are only offering their opinions to investors.
Which Stocks Are Analysts Recommending Now?
Benzinga Edge gives you instant access to all major analyst upgrades, downgrades, and price targets. Sort by accuracy, upside potential, and more. Click here to stay ahead of the market.
This article was generated by Benzinga's automated content engine and reviewed by an editor.
Edge Rankings
Price Trend
© 2025 Benzinga.com. Benzinga does not provide investment advice. All rights reserved.
date | ticker | name | Price Target | Upside/Downside | Recommendation | Firm |
|---|
Trade confidently with insights and alerts from analyst ratings, free reports and breaking news that affects the stocks you care about.

