


Across the recent three months, 4 analysts have shared their insights on Park Hotels & Resorts PK, expressing a variety of opinions spanning from bullish to bearish.
The table below summarizes their recent ratings, showcasing the evolving sentiments within the past 30 days and comparing them to the preceding months.
| Bullish | Somewhat Bullish | Indifferent | Somewhat Bearish | Bearish | |
|---|---|---|---|---|---|
| Total Ratings | 2 | 0 | 2 | 0 | 0 |
| Last 30D | 1 | 0 | 0 | 0 | 0 |
| 1M Ago | 0 | 0 | 0 | 0 | 0 |
| 2M Ago | 0 | 0 | 2 | 0 | 0 |
| 3M Ago | 1 | 0 | 0 | 0 | 0 |
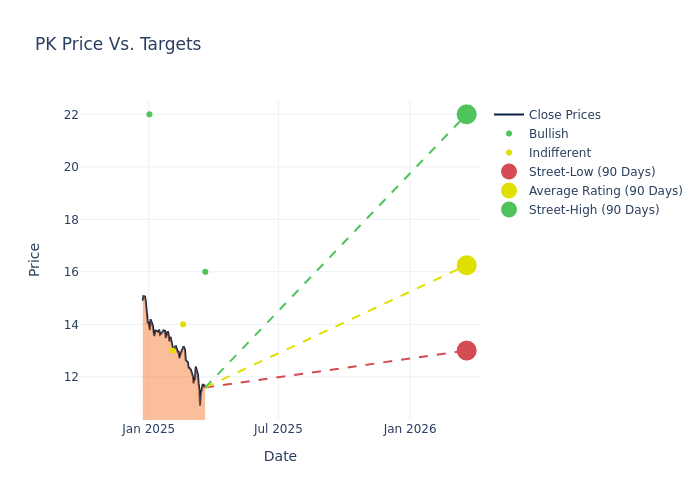
Providing deeper insights, analysts have established 12-month price targets, indicating an average target of $16.25, along with a high estimate of $22.00 and a low estimate of $13.00. Observing a downward trend, the current average is 10.96% lower than the prior average price target of $18.25.
Diving into Analyst Ratings: An In-Depth Exploration
A comprehensive examination of how financial experts perceive Park Hotels & Resorts is derived from recent analyst actions. The following is a detailed summary of key analysts, their recent evaluations, and adjustments to ratings and price targets.
| Analyst | Analyst Firm | Action Taken | Rating | Current Price Target | Prior Price Target |
|---|---|---|---|---|---|
| Patrick Scholes | Truist Securities | Lowers | Buy | $16.00 | $18.00 |
| Dori Kesten | Wells Fargo | Lowers | Equal-Weight | $14.00 | $17.00 |
| Robin Farley | UBS | Lowers | Neutral | $13.00 | $15.00 |
| David Katz | Jefferies | Lowers | Buy | $22.00 | $23.00 |
Key Insights:
- Action Taken: Analysts adapt their recommendations to changing market conditions and company performance. Whether they 'Maintain', 'Raise' or 'Lower' their stance, it reflects their response to recent developments related to Park Hotels & Resorts. This information provides a snapshot of how analysts perceive the current state of the company.
- Rating: Providing a comprehensive analysis, analysts offer qualitative assessments, ranging from 'Outperform' to 'Underperform'. These ratings reflect expectations for the relative performance of Park Hotels & Resorts compared to the broader market.
- Price Targets: Analysts explore the dynamics of price targets, providing estimates for the future value of Park Hotels & Resorts's stock. This examination reveals shifts in analysts' expectations over time.
Capture valuable insights into Park Hotels & Resorts's market standing by understanding these analyst evaluations alongside pertinent financial indicators. Stay informed and make strategic decisions with our Ratings Table.
Stay up to date on Park Hotels & Resorts analyst ratings.
Discovering Park Hotels & Resorts: A Closer Look
Park Hotels & Resorts owns upper-upscale and luxury hotels with 22,711 rooms across 37 hotels in the United States. Park also has interests through joint ventures in another 2,271 rooms in three US hotels. Park was spun out of narrow-moat Hilton Worldwide Holdings at the start of 2017, so most of the company's hotels are still under Hilton brands. The company has sold all its international hotels and many of its lower-quality US hotels to focus on high-quality assets in domestic gateway markets.
Financial Milestones: Park Hotels & Resorts's Journey
Market Capitalization Highlights: Above the industry average, the company's market capitalization signifies a significant scale, indicating strong confidence and market prominence.
Revenue Growth: Park Hotels & Resorts's revenue growth over a period of 3 months has faced challenges. As of 31 December, 2024, the company experienced a revenue decline of approximately -4.87%. This indicates a decrease in the company's top-line earnings. When compared to others in the Real Estate sector, the company faces challenges, achieving a growth rate lower than the average among peers.
Net Margin: Park Hotels & Resorts's net margin excels beyond industry benchmarks, reaching 10.4%. This signifies efficient cost management and strong financial health.
Return on Equity (ROE): Park Hotels & Resorts's ROE excels beyond industry benchmarks, reaching 1.76%. This signifies robust financial management and efficient use of shareholder equity capital.
Return on Assets (ROA): Park Hotels & Resorts's ROA excels beyond industry benchmarks, reaching 0.71%. This signifies efficient management of assets and strong financial health.
Debt Management: With a below-average debt-to-equity ratio of 1.31, Park Hotels & Resorts adopts a prudent financial strategy, indicating a balanced approach to debt management.
Analyst Ratings: Simplified
Benzinga tracks 150 analyst firms and reports on their stock expectations. Analysts typically arrive at their conclusions by predicting how much money a company will make in the future, usually the upcoming five years, and how risky or predictable that company's revenue streams are.
Analysts attend company conference calls and meetings, research company financial statements, and communicate with insiders to publish their ratings on stocks. Analysts typically rate each stock once per quarter or whenever the company has a major update.
Some analysts will also offer forecasts for metrics like growth estimates, earnings, and revenue to provide further guidance on stocks. Investors who use analyst ratings should note that this specialized advice comes from humans and may be subject to error.
Which Stocks Are Analysts Recommending Now?
Benzinga Edge gives you instant access to all major analyst upgrades, downgrades, and price targets. Sort by accuracy, upside potential, and more. Click here to stay ahead of the market.
This article was generated by Benzinga's automated content engine and reviewed by an editor.
Edge Rankings
Price Trend
© 2025 Benzinga.com. Benzinga does not provide investment advice. All rights reserved.
date | ticker | name | Price Target | Upside/Downside | Recommendation | Firm |
|---|
Trade confidently with insights and alerts from analyst ratings, free reports and breaking news that affects the stocks you care about.

