
In the latest quarter, 17 analysts provided ratings for T-Mobile US TMUS, showcasing a mix of bullish and bearish perspectives.
The following table encapsulates their recent ratings, offering a glimpse into the evolving sentiments over the past 30 days and comparing them to the preceding months.
| Bullish | Somewhat Bullish | Indifferent | Somewhat Bearish | Bearish | |
|---|---|---|---|---|---|
| Total Ratings | 5 | 4 | 8 | 0 | 0 |
| Last 30D | 0 | 0 | 1 | 0 | 0 |
| 1M Ago | 0 | 1 | 2 | 0 | 0 |
| 2M Ago | 5 | 3 | 3 | 0 | 0 |
| 3M Ago | 0 | 0 | 2 | 0 | 0 |
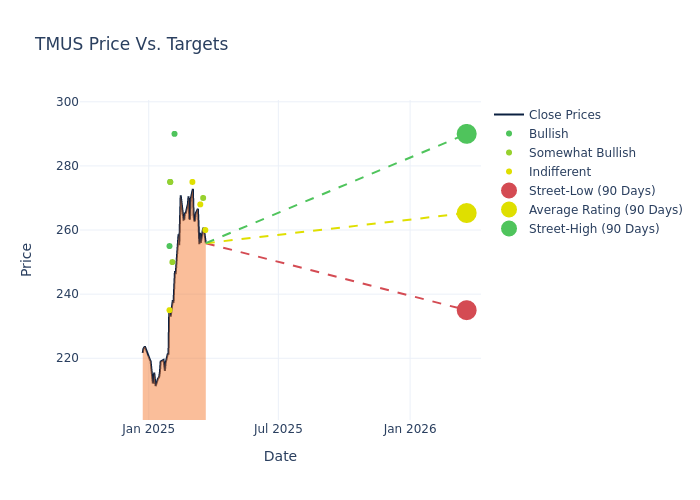
Analysts' evaluations of 12-month price targets offer additional insights, showcasing an average target of $258.82, with a high estimate of $290.00 and a low estimate of $220.00. Marking an increase of 4.55%, the current average surpasses the previous average price target of $247.56.
Diving into Analyst Ratings: An In-Depth Exploration
In examining recent analyst actions, we gain insights into how financial experts perceive T-Mobile US. The following summary outlines key analysts, their recent evaluations, and adjustments to ratings and price targets.
| Analyst | Analyst Firm | Action Taken | Rating | Current Price Target | Prior Price Target |
|---|---|---|---|---|---|
| Jonathan Atkin | RBC Capital | Raises | Sector Perform | $260.00 | $245.00 |
| Sebastiano Petti | JP Morgan | Raises | Overweight | $270.00 | $265.00 |
| Michael Rollins | Citigroup | Announces | Neutral | $268.00 | - |
| Maher Yaghi | Scotiabank | Raises | Sector Perform | $275.00 | $247.00 |
| Ivan Feinseth | Tigress Financial | Raises | Buy | $290.00 | $280.00 |
| Kannan Venkateshwar | Barclays | Raises | Overweight | $250.00 | $230.00 |
| Timothy Horan | Oppenheimer | Raises | Outperform | $275.00 | $250.00 |
| Matthew Harrigan | Benchmark | Raises | Buy | $275.00 | $255.00 |
| David Barden | B of A Securities | Raises | Buy | $255.00 | $240.00 |
| Jonathan Atkin | RBC Capital | Raises | Sector Perform | $245.00 | $240.00 |
| Matthew Harrigan | Benchmark | Raises | Buy | $275.00 | $255.00 |
| Sebastiano Petti | JP Morgan | Raises | Overweight | $265.00 | $250.00 |
| Maher Yaghi | Scotiabank | Raises | Sector Perform | $247.00 | $234.00 |
| Eric Luebchow | Wells Fargo | Raises | Equal-Weight | $235.00 | $220.00 |
| Matthew Harrigan | Benchmark | Maintains | Buy | $255.00 | $255.00 |
| Jonathan Atkin | RBC Capital | Lowers | Sector Perform | $240.00 | $255.00 |
| Eric Luebchow | Wells Fargo | Lowers | Equal-Weight | $220.00 | $240.00 |
Key Insights:
- Action Taken: Analysts respond to changes in market conditions and company performance, frequently updating their recommendations. Whether they 'Maintain', 'Raise' or 'Lower' their stance, it reflects their reaction to recent developments related to T-Mobile US. This information offers a snapshot of how analysts perceive the current state of the company.
- Rating: Offering insights into predictions, analysts assign qualitative values, from 'Outperform' to 'Underperform'. These ratings convey expectations for the relative performance of T-Mobile US compared to the broader market.
- Price Targets: Analysts provide insights into price targets, offering estimates for the future value of T-Mobile US's stock. This comparison reveals trends in analysts' expectations over time.
Navigating through these analyst evaluations alongside other financial indicators can contribute to a holistic understanding of T-Mobile US's market standing. Stay informed and make data-driven decisions with our Ratings Table.
Stay up to date on T-Mobile US analyst ratings.
All You Need to Know About T-Mobile US
Deutsche Telekom merged its T-Mobile USA unit with prepaid specialist MetroPCS in 2013, and that firm merged with Sprint in 2020, creating the second-largest wireless carrier in the us. T-Mobile now serves 77 million postpaid and 21 million prepaid phone customers, equal to around 30% of the us retail wireless market. The firm entered the fixed-wireless broadband market aggressively in 2021 and now serves more than 5 million residential and business customers. In addition, T-Mobile provides wholesale services to resellers.
T-Mobile US: Financial Performance Dissected
Market Capitalization Analysis: Above industry benchmarks, the company's market capitalization emphasizes a noteworthy size, indicative of a strong market presence.
Positive Revenue Trend: Examining T-Mobile US's financials over 3 months reveals a positive narrative. The company achieved a noteworthy revenue growth rate of 6.81% as of 31 December, 2024, showcasing a substantial increase in top-line earnings. As compared to its peers, the company achieved a growth rate higher than the average among peers in Communication Services sector.
Net Margin: The company's net margin is a standout performer, exceeding industry averages. With an impressive net margin of 13.63%, the company showcases strong profitability and effective cost control.
Return on Equity (ROE): T-Mobile US's ROE stands out, surpassing industry averages. With an impressive ROE of 4.73%, the company demonstrates effective use of equity capital and strong financial performance.
Return on Assets (ROA): T-Mobile US's ROA surpasses industry standards, highlighting the company's exceptional financial performance. With an impressive 1.42% ROA, the company effectively utilizes its assets for optimal returns.
Debt Management: T-Mobile US's debt-to-equity ratio is below the industry average. With a ratio of 1.85, the company relies less on debt financing, maintaining a healthier balance between debt and equity, which can be viewed positively by investors.
Analyst Ratings: What Are They?
Analysts work in banking and financial systems and typically specialize in reporting for stocks or defined sectors. Analysts may attend company conference calls and meetings, research company financial statements, and communicate with insiders to publish "analyst ratings" for stocks. Analysts typically rate each stock once per quarter.
Some analysts also offer predictions for helpful metrics such as earnings, revenue, and growth estimates to provide further guidance as to what to do with certain tickers. It is important to keep in mind that while stock and sector analysts are specialists, they are also human and can only forecast their beliefs to traders.
Breaking: Wall Street's Next Big Mover
Benzinga's #1 analyst just identified a stock poised for explosive growth. This under-the-radar company could surge 200%+ as major market shifts unfold. Click here for urgent details.
This article was generated by Benzinga's automated content engine and reviewed by an editor.
Edge Rankings
Price Trend
© 2025 Benzinga.com. Benzinga does not provide investment advice. All rights reserved.
date | ticker | name | Price Target | Upside/Downside | Recommendation | Firm |
|---|
Trade confidently with insights and alerts from analyst ratings, free reports and breaking news that affects the stocks you care about.

