


Providing a diverse range of perspectives from bullish to bearish, 7 analysts have published ratings on Liberty Energy LBRT in the last three months.
The table below provides a snapshot of their recent ratings, showcasing how sentiments have evolved over the past 30 days and comparing them to the preceding months.
| Bullish | Somewhat Bullish | Indifferent | Somewhat Bearish | Bearish | |
|---|---|---|---|---|---|
| Total Ratings | 2 | 2 | 3 | 0 | 0 |
| Last 30D | 0 | 0 | 1 | 0 | 0 |
| 1M Ago | 0 | 0 | 0 | 0 | 0 |
| 2M Ago | 1 | 2 | 0 | 0 | 0 |
| 3M Ago | 1 | 0 | 2 | 0 | 0 |
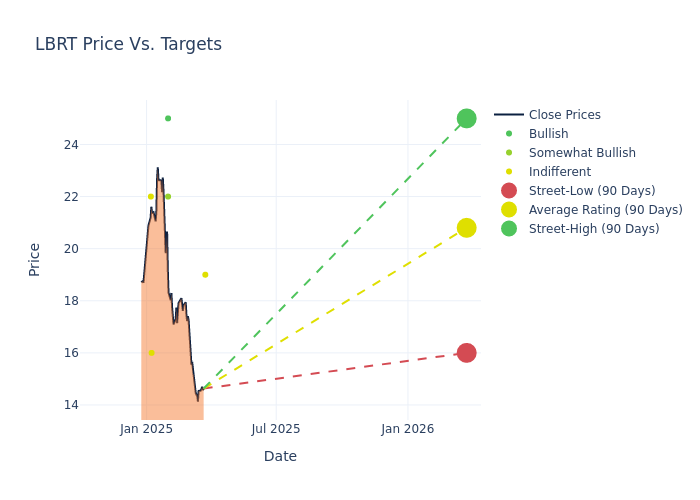
Analysts' evaluations of 12-month price targets offer additional insights, showcasing an average target of $21.57, with a high estimate of $25.00 and a low estimate of $16.00. A 5.02% drop is evident in the current average compared to the previous average price target of $22.71.
Exploring Analyst Ratings: An In-Depth Overview
The standing of Liberty Energy among financial experts is revealed through an in-depth exploration of recent analyst actions. The summary below outlines key analysts, their recent evaluations, and adjustments to ratings and price targets.
| Analyst | Analyst Firm | Action Taken | Rating | Current Price Target | Prior Price Target |
|---|---|---|---|---|---|
| Keith Mackey | RBC Capital | Lowers | Sector Perform | $19.00 | $24.00 |
| Keith Mackey | RBC Capital | Lowers | Outperform | $24.00 | $26.00 |
| Stephen Gengaro | Stifel | Raises | Buy | $25.00 | $23.00 |
| Roger Read | Wells Fargo | Lowers | Overweight | $22.00 | $24.00 |
| Marc Bianchi | TD Cowen | Lowers | Hold | $16.00 | $18.00 |
| Scott Gruber | Citigroup | Raises | Neutral | $22.00 | $19.00 |
| Stephen Gengaro | Stifel | Lowers | Buy | $23.00 | $25.00 |
Key Insights:
- Action Taken: Responding to changing market dynamics and company performance, analysts update their recommendations. Whether they 'Maintain', 'Raise', or 'Lower' their stance, it signifies their response to recent developments related to Liberty Energy. This offers insight into analysts' perspectives on the current state of the company.
- Rating: Providing a comprehensive analysis, analysts offer qualitative assessments, ranging from 'Outperform' to 'Underperform'. These ratings reflect expectations for the relative performance of Liberty Energy compared to the broader market.
- Price Targets: Analysts navigate through adjustments in price targets, providing estimates for Liberty Energy's future value. Comparing current and prior targets offers insights into analysts' evolving expectations.
For valuable insights into Liberty Energy's market performance, consider these analyst evaluations alongside crucial financial indicators. Stay well-informed and make prudent decisions using our Ratings Table.
Stay up to date on Liberty Energy analyst ratings.
All You Need to Know About Liberty Energy
Liberty Energy Inc is a integrated energy services and technology company focused on providing hydraulic fracturing services and related technologies to onshore oil and natural gas exploration and production (E&P) companies. The Company offers customers with hydraulic fracturing services, together with complementary services including wireline services, proppant delivery solutions, field gas processing and treating, compressed natural gas (CNG) delivery, data analytics, related goods (including sand mine operations), and technologies to facilitate lower emission completions, thereby helping customers reduce emissions profile. The company provides services across USA and Canada.
Financial Insights: Liberty Energy
Market Capitalization Perspectives: The company's market capitalization falls below industry averages, signaling a relatively smaller size compared to peers. This positioning may be influenced by factors such as perceived growth potential or operational scale.
Negative Revenue Trend: Examining Liberty Energy's financials over 3 months reveals challenges. As of 31 December, 2024, the company experienced a decline of approximately -12.22% in revenue growth, reflecting a decrease in top-line earnings. In comparison to its industry peers, the company trails behind with a growth rate lower than the average among peers in the Energy sector.
Net Margin: Liberty Energy's net margin lags behind industry averages, suggesting challenges in maintaining strong profitability. With a net margin of 5.5%, the company may face hurdles in effective cost management.
Return on Equity (ROE): The company's ROE is below industry benchmarks, signaling potential difficulties in efficiently using equity capital. With an ROE of 2.63%, the company may need to address challenges in generating satisfactory returns for shareholders.
Return on Assets (ROA): Liberty Energy's ROA surpasses industry standards, highlighting the company's exceptional financial performance. With an impressive 1.58% ROA, the company effectively utilizes its assets for optimal returns.
Debt Management: Liberty Energy's debt-to-equity ratio is below the industry average at 0.27, reflecting a lower dependency on debt financing and a more conservative financial approach.
Analyst Ratings: Simplified
Ratings come from analysts, or specialists within banking and financial systems that report for specific stocks or defined sectors (typically once per quarter for each stock). Analysts usually derive their information from company conference calls and meetings, financial statements, and conversations with important insiders to reach their decisions.
Some analysts also offer predictions for helpful metrics such as earnings, revenue, and growth estimates to provide further guidance as to what to do with certain tickers. It is important to keep in mind that while stock and sector analysts are specialists, they are also human and can only forecast their beliefs to traders.
Which Stocks Are Analysts Recommending Now?
Benzinga Edge gives you instant access to all major analyst upgrades, downgrades, and price targets. Sort by accuracy, upside potential, and more. Click here to stay ahead of the market.
This article was generated by Benzinga's automated content engine and reviewed by an editor.
Edge Rankings
Price Trend
© 2025 Benzinga.com. Benzinga does not provide investment advice. All rights reserved.
date | ticker | name | Price Target | Upside/Downside | Recommendation | Firm |
|---|
Trade confidently with insights and alerts from analyst ratings, free reports and breaking news that affects the stocks you care about.

