
Terreno Realty TRNO has been analyzed by 10 analysts in the last three months, revealing a diverse range of perspectives from bullish to bearish.
The table below provides a concise overview of recent ratings by analysts, offering insights into the changing sentiments over the past 30 days and drawing comparisons with the preceding months for a holistic perspective.
| Bullish | Somewhat Bullish | Indifferent | Somewhat Bearish | Bearish | |
|---|---|---|---|---|---|
| Total Ratings | 1 | 3 | 6 | 0 | 0 |
| Last 30D | 0 | 0 | 1 | 0 | 0 |
| 1M Ago | 0 | 0 | 1 | 0 | 0 |
| 2M Ago | 1 | 2 | 2 | 0 | 0 |
| 3M Ago | 0 | 1 | 2 | 0 | 0 |
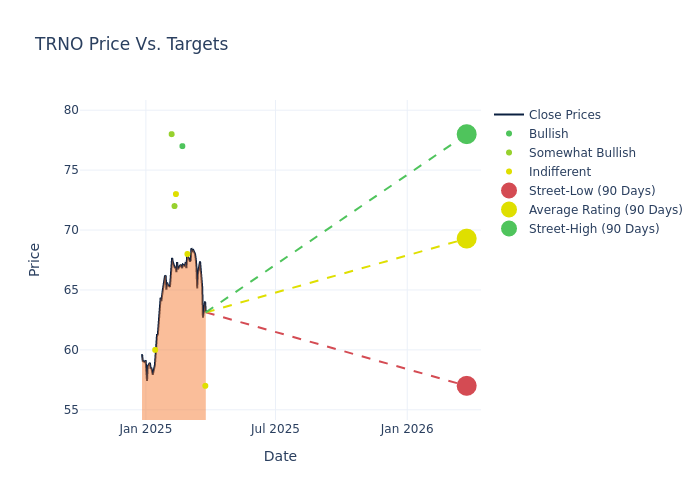
Analysts provide deeper insights through their assessments of 12-month price targets, revealing an average target of $68.8, a high estimate of $78.00, and a low estimate of $57.00. Observing a downward trend, the current average is 0.29% lower than the prior average price target of $69.00.
Investigating Analyst Ratings: An Elaborate Study
The standing of Terreno Realty among financial experts becomes clear with a thorough analysis of recent analyst actions. The summary below outlines key analysts, their recent evaluations, and adjustments to ratings and price targets.
| Analyst | Analyst Firm | Action Taken | Rating | Current Price Target | Prior Price Target |
|---|---|---|---|---|---|
| Brendan Lynch | Barclays | Lowers | Equal-Weight | $57.00 | $60.00 |
| Greg McGinniss | Scotiabank | Raises | Sector Perform | $68.00 | $64.00 |
| Caitlin Burrows | Goldman Sachs | Raises | Buy | $77.00 | $65.00 |
| John Kim | BMO Capital | Raises | Market Perform | $73.00 | $71.00 |
| Mitch Germain | JMP Securities | Maintains | Market Outperform | $72.00 | $72.00 |
| Alexander Goldfarb | Piper Sandler | Lowers | Overweight | $78.00 | $80.00 |
| John Kim | BMO Capital | Announces | Market Perform | $71.00 | - |
| Omotayo Okusanya | Deutsche Bank | Announces | Hold | $60.00 | - |
| Brendan Lynch | Barclays | Lowers | Equal-Weight | $60.00 | $68.00 |
| Mitch Germain | JMP Securities | Maintains | Market Outperform | $72.00 | $72.00 |
Key Insights:
- Action Taken: Responding to changing market dynamics and company performance, analysts update their recommendations. Whether they 'Maintain', 'Raise', or 'Lower' their stance, it signifies their response to recent developments related to Terreno Realty. This offers insight into analysts' perspectives on the current state of the company.
- Rating: Analysts assign qualitative assessments to stocks, ranging from 'Outperform' to 'Underperform'. These ratings convey the analysts' expectations for the relative performance of Terreno Realty compared to the broader market.
- Price Targets: Understanding forecasts, analysts offer estimates for Terreno Realty's future value. Examining the current and prior targets provides insight into analysts' changing expectations.
Assessing these analyst evaluations alongside crucial financial indicators can provide a comprehensive overview of Terreno Realty's market position. Stay informed and make well-judged decisions with the assistance of our Ratings Table.
Stay up to date on Terreno Realty analyst ratings.
About Terreno Realty
Terreno Realty Corp is a real estate investment trust engaged in acquiring, owning, and operating industrial real estate in six coastal U.S. markets: Los Angeles, Northern New Jersey/New York City, San Francisco Bay Area, Seattle, Miami, and Washington, D.C. The company invests in several types of industrial real estate, including warehouse/distribution, flex (including light industrial and research and development), transshipment, and improved land.
Breaking Down Terreno Realty's Financial Performance
Market Capitalization Analysis: The company's market capitalization is below the industry average, suggesting that it is relatively smaller compared to peers. This could be due to various factors, including perceived growth potential or operational scale.
Positive Revenue Trend: Examining Terreno Realty's financials over 3 months reveals a positive narrative. The company achieved a noteworthy revenue growth rate of 19.92% as of 31 December, 2024, showcasing a substantial increase in top-line earnings. In comparison to its industry peers, the company stands out with a growth rate higher than the average among peers in the Real Estate sector.
Net Margin: Terreno Realty's net margin surpasses industry standards, highlighting the company's exceptional financial performance. With an impressive 73.07% net margin, the company effectively manages costs and achieves strong profitability.
Return on Equity (ROE): Terreno Realty's ROE is below industry standards, pointing towards difficulties in efficiently utilizing equity capital. With an ROE of 2.08%, the company may encounter challenges in delivering satisfactory returns for shareholders.
Return on Assets (ROA): Terreno Realty's ROA stands out, surpassing industry averages. With an impressive ROA of 1.62%, the company demonstrates effective utilization of assets and strong financial performance.
Debt Management: The company maintains a balanced debt approach with a debt-to-equity ratio below industry norms, standing at 0.22.
How Are Analyst Ratings Determined?
Experts in banking and financial systems, analysts specialize in reporting for specific stocks or defined sectors. Their comprehensive research involves attending company conference calls and meetings, analyzing financial statements, and engaging with insiders to generate what are known as analyst ratings for stocks. Typically, analysts assess and rate each stock once per quarter.
Some analysts will also offer forecasts for metrics like growth estimates, earnings, and revenue to provide further guidance on stocks. Investors who use analyst ratings should note that this specialized advice comes from humans and may be subject to error.
Which Stocks Are Analysts Recommending Now?
Benzinga Edge gives you instant access to all major analyst upgrades, downgrades, and price targets. Sort by accuracy, upside potential, and more. Click here to stay ahead of the market.
This article was generated by Benzinga's automated content engine and reviewed by an editor.
Edge Rankings
Price Trend
© 2025 Benzinga.com. Benzinga does not provide investment advice. All rights reserved.
date | ticker | name | Price Target | Upside/Downside | Recommendation | Firm |
|---|
Trade confidently with insights and alerts from analyst ratings, free reports and breaking news that affects the stocks you care about.

