


APi Group APG has been analyzed by 7 analysts in the last three months, revealing a diverse range of perspectives from bullish to bearish.
The table below provides a concise overview of recent ratings by analysts, offering insights into the changing sentiments over the past 30 days and drawing comparisons with the preceding months for a holistic perspective.
| Bullish | Somewhat Bullish | Indifferent | Somewhat Bearish | Bearish | |
|---|---|---|---|---|---|
| Total Ratings | 4 | 3 | 0 | 0 | 0 |
| Last 30D | 0 | 1 | 0 | 0 | 0 |
| 1M Ago | 1 | 1 | 0 | 0 | 0 |
| 2M Ago | 1 | 0 | 0 | 0 | 0 |
| 3M Ago | 2 | 1 | 0 | 0 | 0 |
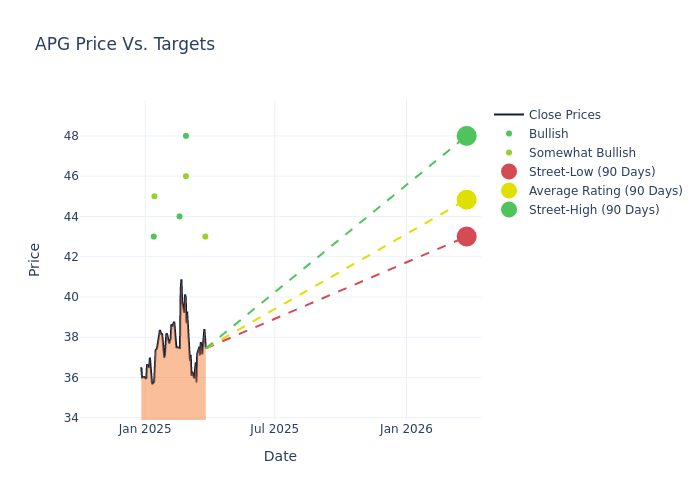
The 12-month price targets, analyzed by analysts, offer insights with an average target of $44.86, a high estimate of $48.00, and a low estimate of $43.00. This upward trend is apparent, with the current average reflecting a 1.95% increase from the previous average price target of $44.00.
Breaking Down Analyst Ratings: A Detailed Examination
The standing of APi Group among financial experts becomes clear with a thorough analysis of recent analyst actions. The summary below outlines key analysts, their recent evaluations, and adjustments to ratings and price targets.
| Analyst | Analyst Firm | Action Taken | Rating | Current Price Target | Prior Price Target |
|---|---|---|---|---|---|
| Julian Mitchell | Barclays | Lowers | Overweight | $43.00 | $44.00 |
| Jasper Bibb | Truist Securities | Raises | Buy | $48.00 | $45.00 |
| Andrew Wittmann | Baird | Raises | Outperform | $46.00 | $40.00 |
| Joshua Chan | UBS | Lowers | Buy | $44.00 | $45.00 |
| Jasper Bibb | Truist Securities | Announces | Buy | $45.00 | - |
| Ashish Sabadra | RBC Capital | Maintains | Outperform | $45.00 | $45.00 |
| Andrew Kaplowitz | Citigroup | Lowers | Buy | $43.00 | $45.00 |
Key Insights:
- Action Taken: Analysts frequently update their recommendations based on evolving market conditions and company performance. Whether they 'Maintain', 'Raise' or 'Lower' their stance, it reflects their reaction to recent developments related to APi Group. This information provides a snapshot of how analysts perceive the current state of the company.
- Rating: Gaining insights, analysts provide qualitative assessments, ranging from 'Outperform' to 'Underperform'. These ratings reflect expectations for the relative performance of APi Group compared to the broader market.
- Price Targets: Analysts explore the dynamics of price targets, providing estimates for the future value of APi Group's stock. This examination reveals shifts in analysts' expectations over time.
Navigating through these analyst evaluations alongside other financial indicators can contribute to a holistic understanding of APi Group's market standing. Stay informed and make data-driven decisions with our Ratings Table.
Stay up to date on APi Group analyst ratings.
Delving into APi Group's Background
APi Group Corp operates in two segments: Safety Services segment includes providing safety services in North America, Asia Pacific, and Europe, focusing on end-to-end integrated occupancy systems (fire protection solutions, Heating, Ventilation, and Air Conditioning and entry systems), including design, installation, inspection, and service of these integrated systems. These services are provided in commercial, education, healthcare, high tech, industrial, and special-hazard settings. Specialty Services segment includes providing a variety of infrastructure services and specialized industrial plant services, which include maintenance and repair of critical infrastructure such as underground electric, gas, water, sewer, and telecommunications infrastructure.
APi Group: Financial Performance Dissected
Market Capitalization Analysis: With an elevated market capitalization, the company stands out above industry averages, showcasing substantial size and market acknowledgment.
Revenue Growth: Over the 3 months period, APi Group showcased positive performance, achieving a revenue growth rate of 5.8% as of 31 December, 2024. This reflects a substantial increase in the company's top-line earnings. When compared to others in the Industrials sector, the company faces challenges, achieving a growth rate lower than the average among peers.
Net Margin: APi Group's net margin is below industry standards, pointing towards difficulties in achieving strong profitability. With a net margin of -1.5%, the company may encounter challenges in effective cost control.
Return on Equity (ROE): The company's ROE is below industry benchmarks, signaling potential difficulties in efficiently using equity capital. With an ROE of -0.95%, the company may need to address challenges in generating satisfactory returns for shareholders.
Return on Assets (ROA): APi Group's ROA is below industry averages, indicating potential challenges in efficiently utilizing assets. With an ROA of -0.34%, the company may face hurdles in achieving optimal financial returns.
Debt Management: APi Group's debt-to-equity ratio is notably higher than the industry average. With a ratio of 1.03, the company relies more heavily on borrowed funds, indicating a higher level of financial risk.
What Are Analyst Ratings?
Within the domain of banking and financial systems, analysts specialize in reporting for specific stocks or defined sectors. Their work involves attending company conference calls and meetings, researching company financial statements, and communicating with insiders to publish "analyst ratings" for stocks. Analysts typically assess and rate each stock once per quarter.
Some analysts publish their predictions for metrics such as growth estimates, earnings, and revenue to provide additional guidance with their ratings. When using analyst ratings, it is important to keep in mind that stock and sector analysts are also human and are only offering their opinions to investors.
Which Stocks Are Analysts Recommending Now?
Benzinga Edge gives you instant access to all major analyst upgrades, downgrades, and price targets. Sort by accuracy, upside potential, and more. Click here to stay ahead of the market.
This article was generated by Benzinga's automated content engine and reviewed by an editor.
Edge Rankings
Price Trend
© 2025 Benzinga.com. Benzinga does not provide investment advice. All rights reserved.
date | ticker | name | Price Target | Upside/Downside | Recommendation | Firm |
|---|
Trade confidently with insights and alerts from analyst ratings, free reports and breaking news that affects the stocks you care about.

