


In the last three months, 11 analysts have published ratings on Church & Dwight Co CHD, offering a diverse range of perspectives from bullish to bearish.
Summarizing their recent assessments, the table below illustrates the evolving sentiments in the past 30 days and compares them to the preceding months.
| Bullish | Somewhat Bullish | Indifferent | Somewhat Bearish | Bearish | |
|---|---|---|---|---|---|
| Total Ratings | 1 | 2 | 3 | 5 | 0 |
| Last 30D | 0 | 0 | 0 | 1 | 0 |
| 1M Ago | 0 | 0 | 0 | 0 | 0 |
| 2M Ago | 1 | 1 | 2 | 2 | 0 |
| 3M Ago | 0 | 1 | 1 | 2 | 0 |
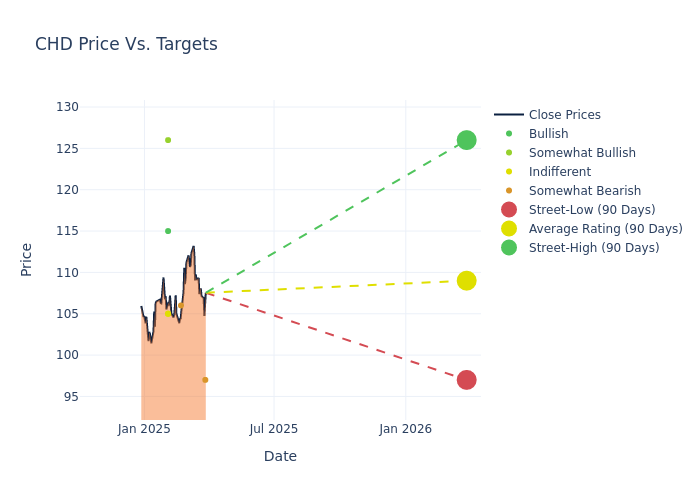
Insights from analysts' 12-month price targets are revealed, presenting an average target of $106.82, a high estimate of $128.00, and a low estimate of $90.00. This current average has increased by 2.27% from the previous average price target of $104.45.
Understanding Analyst Ratings: A Comprehensive Breakdown
An in-depth analysis of recent analyst actions unveils how financial experts perceive Church & Dwight Co. The following summary outlines key analysts, their recent evaluations, and adjustments to ratings and price targets.
| Analyst | Analyst Firm | Action Taken | Rating | Current Price Target | Prior Price Target |
|---|---|---|---|---|---|
| Lauren Lieberman | Barclays | Raises | Underweight | $97.00 | $93.00 |
| Andrea Teixeira | JP Morgan | Lowers | Underweight | $106.00 | $107.00 |
| Lauren Lieberman | Barclays | Raises | Underweight | $93.00 | $90.00 |
| Bill Chappell | Truist Securities | Raises | Buy | $115.00 | $110.00 |
| Mark Astrachan | Stifel | Raises | Hold | $105.00 | $103.00 |
| Nik Modi | RBC Capital | Maintains | Sector Perform | $105.00 | $105.00 |
| Korinne Wolfmeyer | Piper Sandler | Lowers | Overweight | $126.00 | $128.00 |
| Mark Astrachan | Stifel | Lowers | Hold | $103.00 | $105.00 |
| Lauren Lieberman | Barclays | Raises | Underweight | $90.00 | $85.00 |
| Andrea Teixeira | JP Morgan | Raises | Underweight | $107.00 | $99.00 |
| Korinne Wolfmeyer | Piper Sandler | Raises | Overweight | $128.00 | $124.00 |
Key Insights:
- Action Taken: In response to dynamic market conditions and company performance, analysts update their recommendations. Whether they 'Maintain', 'Raise', or 'Lower' their stance, it signifies their reaction to recent developments related to Church & Dwight Co. This insight gives a snapshot of analysts' perspectives on the current state of the company.
- Rating: Offering a comprehensive view, analysts assess stocks qualitatively, spanning from 'Outperform' to 'Underperform'. These ratings convey expectations for the relative performance of Church & Dwight Co compared to the broader market.
- Price Targets: Delving into movements, analysts provide estimates for the future value of Church & Dwight Co's stock. This analysis reveals shifts in analysts' expectations over time.
Understanding these analyst evaluations alongside key financial indicators can offer valuable insights into Church & Dwight Co's market standing. Stay informed and make well-considered decisions with our Ratings Table.
Stay up to date on Church & Dwight Co analyst ratings.
All You Need to Know About Church & Dwight Co
Church & Dwight is the leading global producer of baking soda. Its portfolio extends beyond its legacy category to include laundry products, cat litter, oral care, deodorant, and nasal care, all sold under the Arm & Hammer brand. Its mix also includes Batiste, OxiClean, Vitafusion, Waterpik, Hero, and TheraBreath, which together with Arm & Hammer constitute around 70% of its annual sales and profits. Even as it works to grow the reach of its products, Church & Dwight still derives around 80% of its sales from its home market in the US.
Church & Dwight Co's Financial Performance
Market Capitalization Analysis: The company's market capitalization is below the industry average, suggesting that it is relatively smaller compared to peers. This could be due to various factors, including perceived growth potential or operational scale.
Revenue Growth: Over the 3 months period, Church & Dwight Co showcased positive performance, achieving a revenue growth rate of 3.53% as of 31 December, 2024. This reflects a substantial increase in the company's top-line earnings. As compared to competitors, the company surpassed expectations with a growth rate higher than the average among peers in the Consumer Staples sector.
Net Margin: Church & Dwight Co's net margin is impressive, surpassing industry averages. With a net margin of 11.96%, the company demonstrates strong profitability and effective cost management.
Return on Equity (ROE): Church & Dwight Co's ROE is below industry standards, pointing towards difficulties in efficiently utilizing equity capital. With an ROE of 4.42%, the company may encounter challenges in delivering satisfactory returns for shareholders.
Return on Assets (ROA): Church & Dwight Co's ROA is below industry standards, pointing towards difficulties in efficiently utilizing assets. With an ROA of 2.16%, the company may encounter challenges in delivering satisfactory returns from its assets.
Debt Management: With a below-average debt-to-equity ratio of 0.51, Church & Dwight Co adopts a prudent financial strategy, indicating a balanced approach to debt management.
What Are Analyst Ratings?
Ratings come from analysts, or specialists within banking and financial systems that report for specific stocks or defined sectors (typically once per quarter for each stock). Analysts usually derive their information from company conference calls and meetings, financial statements, and conversations with important insiders to reach their decisions.
Beyond their standard evaluations, some analysts contribute predictions for metrics like growth estimates, earnings, and revenue, furnishing investors with additional guidance. Users of analyst ratings should be mindful that this specialized advice is shaped by human perspectives and may be subject to variability.
Breaking: Wall Street's Next Big Mover
Benzinga's #1 analyst just identified a stock poised for explosive growth. This under-the-radar company could surge 200%+ as major market shifts unfold. Click here for urgent details.
This article was generated by Benzinga's automated content engine and reviewed by an editor.
Edge Rankings
Price Trend
© 2025 Benzinga.com. Benzinga does not provide investment advice. All rights reserved.
date | ticker | name | Price Target | Upside/Downside | Recommendation | Firm |
|---|
Trade confidently with insights and alerts from analyst ratings, free reports and breaking news that affects the stocks you care about.

