
In the latest quarter, 4 analysts provided ratings for Group 1 Automotive GPI, showcasing a mix of bullish and bearish perspectives.
The table below offers a condensed view of their recent ratings, showcasing the changing sentiments over the past 30 days and comparing them to the preceding months.
| Bullish | Somewhat Bullish | Indifferent | Somewhat Bearish | Bearish | |
|---|---|---|---|---|---|
| Total Ratings | 0 | 3 | 1 | 0 | 0 |
| Last 30D | 0 | 1 | 0 | 0 | 0 |
| 1M Ago | 0 | 0 | 0 | 0 | 0 |
| 2M Ago | 0 | 1 | 1 | 0 | 0 |
| 3M Ago | 0 | 1 | 0 | 0 | 0 |
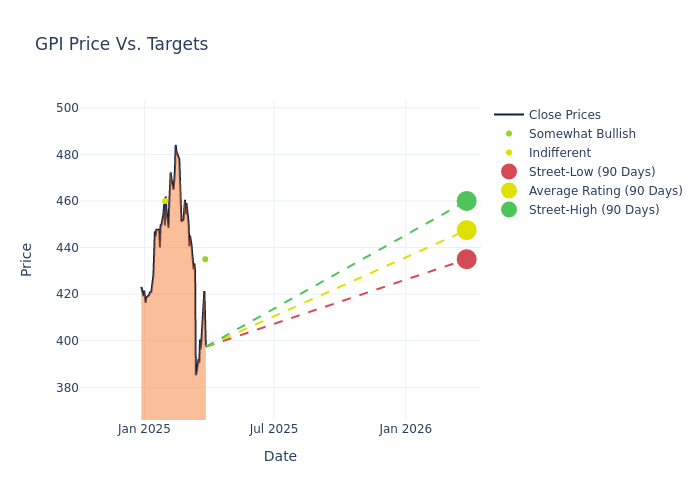
The 12-month price targets assessed by analysts reveal further insights, featuring an average target of $452.5, a high estimate of $495.00, and a low estimate of $420.00. Marking an increase of 0.56%, the current average surpasses the previous average price target of $450.00.
Interpreting Analyst Ratings: A Closer Look
A clear picture of Group 1 Automotive's perception among financial experts is painted with a thorough analysis of recent analyst actions. The summary below outlines key analysts, their recent evaluations, and adjustments to ratings and price targets.
| Analyst | Analyst Firm | Action Taken | Rating | Current Price Target | Prior Price Target |
|---|---|---|---|---|---|
| Rajat Gupta | JP Morgan | Lowers | Overweight | $435.00 | $495.00 |
| Rajat Gupta | JP Morgan | Raises | Overweight | $495.00 | $420.00 |
| Jeff Lick | Stephens & Co. | Maintains | Equal-Weight | $460.00 | $460.00 |
| Rajat Gupta | JP Morgan | Lowers | Overweight | $420.00 | $425.00 |
Key Insights:
- Action Taken: Analysts adapt their recommendations to changing market conditions and company performance. Whether they 'Maintain', 'Raise' or 'Lower' their stance, it reflects their response to recent developments related to Group 1 Automotive. This information provides a snapshot of how analysts perceive the current state of the company.
- Rating: Analysts assign qualitative assessments to stocks, ranging from 'Outperform' to 'Underperform'. These ratings convey the analysts' expectations for the relative performance of Group 1 Automotive compared to the broader market.
- Price Targets: Analysts explore the dynamics of price targets, providing estimates for the future value of Group 1 Automotive's stock. This examination reveals shifts in analysts' expectations over time.
Assessing these analyst evaluations alongside crucial financial indicators can provide a comprehensive overview of Group 1 Automotive's market position. Stay informed and make well-judged decisions with the assistance of our Ratings Table.
Stay up to date on Group 1 Automotive analyst ratings.
Delving into Group 1 Automotive's Background
Group 1 owns and operates 39 collision centers and 258 automotive dealerships in the US and the UK, offering 35 brands of automobiles altogether. Slightly over half of the stores are in the US with locations mostly in metropolitan areas in 17 states in the Northeast, Southeast, Midwest, and California. Texas alone contributed 33.5% of new-vehicle unit volume in 2024 and the UK 22.6%. Texas, Massachusetts, and California combined was 48.5%. Revenue in 2024 totaled $19.9 billion. The August 2024 Inchcape UK deal adds about $2.7 billion of annual revenue and 54 stores to bring the UK store count to 114. The firm entered the UK in 2007. Group 1 was founded in 1995 and is based in Houston.
Group 1 Automotive's Economic Impact: An Analysis
Market Capitalization Highlights: Above the industry average, the company's market capitalization signifies a significant scale, indicating strong confidence and market prominence.
Positive Revenue Trend: Examining Group 1 Automotive's financials over 3 months reveals a positive narrative. The company achieved a noteworthy revenue growth rate of 23.8% as of 31 December, 2024, showcasing a substantial increase in top-line earnings. As compared to its peers, the company achieved a growth rate higher than the average among peers in Consumer Discretionary sector.
Net Margin: Group 1 Automotive's financial strength is reflected in its exceptional net margin, which exceeds industry averages. With a remarkable net margin of 1.68%, the company showcases strong profitability and effective cost management.
Return on Equity (ROE): The company's ROE is a standout performer, exceeding industry averages. With an impressive ROE of 3.12%, the company showcases effective utilization of equity capital.
Return on Assets (ROA): Group 1 Automotive's ROA stands out, surpassing industry averages. With an impressive ROA of 0.94%, the company demonstrates effective utilization of assets and strong financial performance.
Debt Management: Group 1 Automotive's debt-to-equity ratio is below the industry average. With a ratio of 1.76, the company relies less on debt financing, maintaining a healthier balance between debt and equity, which can be viewed positively by investors.
The Significance of Analyst Ratings Explained
Within the domain of banking and financial systems, analysts specialize in reporting for specific stocks or defined sectors. Their work involves attending company conference calls and meetings, researching company financial statements, and communicating with insiders to publish "analyst ratings" for stocks. Analysts typically assess and rate each stock once per quarter.
Analysts may supplement their ratings with predictions for metrics like growth estimates, earnings, and revenue, offering investors a more comprehensive outlook. However, investors should be mindful that analysts, like any human, can have subjective perspectives influencing their forecasts.
Which Stocks Are Analysts Recommending Now?
Benzinga Edge gives you instant access to all major analyst upgrades, downgrades, and price targets. Sort by accuracy, upside potential, and more. Click here to stay ahead of the market.
This article was generated by Benzinga's automated content engine and reviewed by an editor.
Edge Rankings
Price Trend
© 2025 Benzinga.com. Benzinga does not provide investment advice. All rights reserved.
date | ticker | name | Price Target | Upside/Downside | Recommendation | Firm |
|---|
Trade confidently with insights and alerts from analyst ratings, free reports and breaking news that affects the stocks you care about.

