


Throughout the last three months, 4 analysts have evaluated Comstock Resources CRK, offering a diverse set of opinions from bullish to bearish.
The table below provides a concise overview of recent ratings by analysts, offering insights into the changing sentiments over the past 30 days and drawing comparisons with the preceding months for a holistic perspective.
| Bullish | Somewhat Bullish | Indifferent | Somewhat Bearish | Bearish | |
|---|---|---|---|---|---|
| Total Ratings | 0 | 0 | 3 | 1 | 0 |
| Last 30D | 0 | 0 | 1 | 0 | 0 |
| 1M Ago | 0 | 0 | 0 | 0 | 0 |
| 2M Ago | 0 | 0 | 0 | 1 | 0 |
| 3M Ago | 0 | 0 | 2 | 0 | 0 |
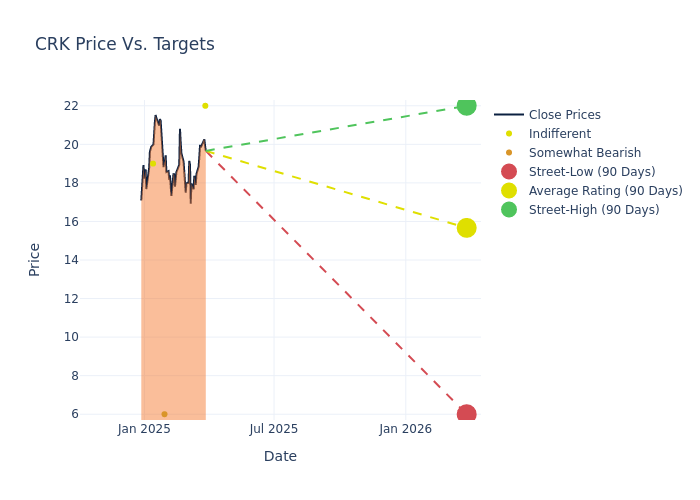
Analysts have recently evaluated Comstock Resources and provided 12-month price targets. The average target is $16.25, accompanied by a high estimate of $22.00 and a low estimate of $6.00. Witnessing a positive shift, the current average has risen by 31.79% from the previous average price target of $12.33.
Diving into Analyst Ratings: An In-Depth Exploration
A comprehensive examination of how financial experts perceive Comstock Resources is derived from recent analyst actions. The following is a detailed summary of key analysts, their recent evaluations, and adjustments to ratings and price targets.
| Analyst | Analyst Firm | Action Taken | Rating | Current Price Target | Prior Price Target |
|---|---|---|---|---|---|
| Devin McDermott | Morgan Stanley | Raises | Equal-Weight | $22.00 | $21.00 |
| Mark Lear | Piper Sandler | Raises | Underweight | $6.00 | $5.00 |
| Neal Dingmann | Truist Securities | Raises | Hold | $19.00 | $11.00 |
| Devin McDermott | Morgan Stanley | Announces | Equal-Weight | $18.00 | - |
Key Insights:
- Action Taken: Analysts adapt their recommendations to changing market conditions and company performance. Whether they 'Maintain', 'Raise' or 'Lower' their stance, it reflects their response to recent developments related to Comstock Resources. This information provides a snapshot of how analysts perceive the current state of the company.
- Rating: Analysts assign qualitative assessments to stocks, ranging from 'Outperform' to 'Underperform'. These ratings convey the analysts' expectations for the relative performance of Comstock Resources compared to the broader market.
- Price Targets: Analysts set price targets as an estimate of a stock's future value. Comparing the current and prior price targets provides insight into how analysts' expectations have changed over time. This information can be valuable for investors seeking to understand consensus views on the stock's potential future performance.
Navigating through these analyst evaluations alongside other financial indicators can contribute to a holistic understanding of Comstock Resources's market standing. Stay informed and make data-driven decisions with our Ratings Table.
Stay up to date on Comstock Resources analyst ratings.
All You Need to Know About Comstock Resources
Comstock Resources Inc is an independent natural gas producer operating in the Haynesville shale, a natural gas basin located in North Louisiana and East Texas with superior economics given its geographical proximity to the Gulf Coast natural gas markets. The Company operates in one business segment, the exploration and production of North American natural gas and oil. It is engaged in the acquisition, development, production, and exploration of oil and natural gas. Its oil and gas operations are concentrated in Louisiana and Texas.
Comstock Resources: Delving into Financials
Market Capitalization Analysis: Falling below industry benchmarks, the company's market capitalization reflects a reduced size compared to peers. This positioning may be influenced by factors such as growth expectations or operational capacity.
Revenue Growth: Comstock Resources's revenue growth over a period of 3 months has faced challenges. As of 31 December, 2024, the company experienced a revenue decline of approximately -10.74%. This indicates a decrease in the company's top-line earnings. As compared to its peers, the revenue growth lags behind its industry peers. The company achieved a growth rate lower than the average among peers in Energy sector.
Net Margin: Comstock Resources's net margin is below industry averages, indicating potential challenges in maintaining strong profitability. With a net margin of -12.89%, the company may face hurdles in effective cost management.
Return on Equity (ROE): Comstock Resources's ROE falls below industry averages, indicating challenges in efficiently using equity capital. With an ROE of -2.08%, the company may face hurdles in generating optimal returns for shareholders.
Return on Assets (ROA): Comstock Resources's ROA is below industry standards, pointing towards difficulties in efficiently utilizing assets. With an ROA of -0.74%, the company may encounter challenges in delivering satisfactory returns from its assets.
Debt Management: Comstock Resources's debt-to-equity ratio surpasses industry norms, standing at 1.35. This suggests the company carries a substantial amount of debt, posing potential financial challenges.
The Significance of Analyst Ratings Explained
Experts in banking and financial systems, analysts specialize in reporting for specific stocks or defined sectors. Their comprehensive research involves attending company conference calls and meetings, analyzing financial statements, and engaging with insiders to generate what are known as analyst ratings for stocks. Typically, analysts assess and rate each stock once per quarter.
Analysts may enhance their evaluations by incorporating forecasts for metrics like growth estimates, earnings, and revenue, delivering additional guidance to investors. It is vital to acknowledge that, although experts in stocks and sectors, analysts are human and express their opinions when providing insights.
Which Stocks Are Analysts Recommending Now?
Benzinga Edge gives you instant access to all major analyst upgrades, downgrades, and price targets. Sort by accuracy, upside potential, and more. Click here to stay ahead of the market.
This article was generated by Benzinga's automated content engine and reviewed by an editor.
Edge Rankings
Price Trend
© 2025 Benzinga.com. Benzinga does not provide investment advice. All rights reserved.
date | ticker | name | Price Target | Upside/Downside | Recommendation | Firm |
|---|
Trade confidently with insights and alerts from analyst ratings, free reports and breaking news that affects the stocks you care about.

