
In the last three months, 5 analysts have published ratings on Chart Industries GTLS, offering a diverse range of perspectives from bullish to bearish.
The table below provides a snapshot of their recent ratings, showcasing how sentiments have evolved over the past 30 days and comparing them to the preceding months.
| Bullish | Somewhat Bullish | Indifferent | Somewhat Bearish | Bearish | |
|---|---|---|---|---|---|
| Total Ratings | 2 | 2 | 1 | 0 | 0 |
| Last 30D | 0 | 1 | 0 | 0 | 0 |
| 1M Ago | 0 | 1 | 1 | 0 | 0 |
| 2M Ago | 1 | 0 | 0 | 0 | 0 |
| 3M Ago | 1 | 0 | 0 | 0 | 0 |
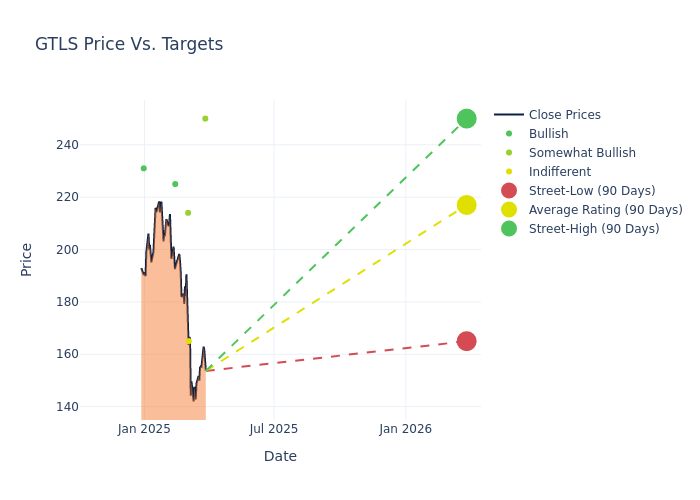
Analysts have recently evaluated Chart Industries and provided 12-month price targets. The average target is $217.0, accompanied by a high estimate of $250.00 and a low estimate of $165.00. Observing a 5.85% increase, the current average has risen from the previous average price target of $205.00.
Investigating Analyst Ratings: An Elaborate Study
The standing of Chart Industries among financial experts becomes clear with a thorough analysis of recent analyst actions. The summary below outlines key analysts, their recent evaluations, and adjustments to ratings and price targets.
| Analyst | Analyst Firm | Action Taken | Rating | Current Price Target | Prior Price Target |
|---|---|---|---|---|---|
| Daniel Kutz | Morgan Stanley | Lowers | Overweight | $250.00 | $275.00 |
| David Anderson | Barclays | Raises | Equal-Weight | $165.00 | $145.00 |
| Roger Read | Wells Fargo | Lowers | Overweight | $214.00 | $215.00 |
| Scott Gruber | Citigroup | Raises | Buy | $225.00 | $190.00 |
| Benjamin Nolan | Stifel | Raises | Buy | $231.00 | $200.00 |
Key Insights:
- Action Taken: In response to dynamic market conditions and company performance, analysts update their recommendations. Whether they 'Maintain', 'Raise', or 'Lower' their stance, it signifies their reaction to recent developments related to Chart Industries. This insight gives a snapshot of analysts' perspectives on the current state of the company.
- Rating: Analyzing trends, analysts offer qualitative evaluations, ranging from 'Outperform' to 'Underperform'. These ratings convey expectations for the relative performance of Chart Industries compared to the broader market.
- Price Targets: Analysts explore the dynamics of price targets, providing estimates for the future value of Chart Industries's stock. This examination reveals shifts in analysts' expectations over time.
Navigating through these analyst evaluations alongside other financial indicators can contribute to a holistic understanding of Chart Industries's market standing. Stay informed and make data-driven decisions with our Ratings Table.
Stay up to date on Chart Industries analyst ratings.
Delving into Chart Industries's Background
Chart Industries provides a variety of cryogenic equipment for storage, distribution, and other processes within the industrial gas and liquefied natural gas industries. It also provides natural gas processing solutions for the natural gas industry and specialty products that serve a variety of spaces, including hydrogen, biofuels, cannabis, and water treatment. The firm acquired Howden in a significant deal in early 2023, roughly doubling the size of the company.
Financial Insights: Chart Industries
Market Capitalization Analysis: Below industry benchmarks, the company's market capitalization reflects a smaller scale relative to peers. This could be attributed to factors such as growth expectations or operational capacity.
Revenue Growth: Chart Industries's remarkable performance in 3 months is evident. As of 31 December, 2024, the company achieved an impressive revenue growth rate of 9.04%. This signifies a substantial increase in the company's top-line earnings. As compared to its peers, the company achieved a growth rate higher than the average among peers in Industrials sector.
Net Margin: Chart Industries's net margin is below industry averages, indicating potential challenges in maintaining strong profitability. With a net margin of 6.58%, the company may face hurdles in effective cost management.
Return on Equity (ROE): The company's ROE is below industry benchmarks, signaling potential difficulties in efficiently using equity capital. With an ROE of 2.51%, the company may need to address challenges in generating satisfactory returns for shareholders.
Return on Assets (ROA): Chart Industries's ROA falls below industry averages, indicating challenges in efficiently utilizing assets. With an ROA of 0.78%, the company may face hurdles in generating optimal returns from its assets.
Debt Management: With a high debt-to-equity ratio of 1.29, Chart Industries faces challenges in effectively managing its debt levels, indicating potential financial strain.
The Core of Analyst Ratings: What Every Investor Should Know
Experts in banking and financial systems, analysts specialize in reporting for specific stocks or defined sectors. Their comprehensive research involves attending company conference calls and meetings, analyzing financial statements, and engaging with insiders to generate what are known as analyst ratings for stocks. Typically, analysts assess and rate each stock once per quarter.
Beyond their standard evaluations, some analysts contribute predictions for metrics like growth estimates, earnings, and revenue, furnishing investors with additional guidance. Users of analyst ratings should be mindful that this specialized advice is shaped by human perspectives and may be subject to variability.
Breaking: Wall Street's Next Big Mover
Benzinga's #1 analyst just identified a stock poised for explosive growth. This under-the-radar company could surge 200%+ as major market shifts unfold. Click here for urgent details.
This article was generated by Benzinga's automated content engine and reviewed by an editor.
Edge Rankings
Price Trend
© 2025 Benzinga.com. Benzinga does not provide investment advice. All rights reserved.
date | ticker | name | Price Target | Upside/Downside | Recommendation | Firm |
|---|
Trade confidently with insights and alerts from analyst ratings, free reports and breaking news that affects the stocks you care about.

