


H.B. Fuller FUL has been analyzed by 4 analysts in the last three months, revealing a diverse range of perspectives from bullish to bearish.
The following table encapsulates their recent ratings, offering a glimpse into the evolving sentiments over the past 30 days and comparing them to the preceding months.
| Bullish | Somewhat Bullish | Indifferent | Somewhat Bearish | Bearish | |
|---|---|---|---|---|---|
| Total Ratings | 1 | 0 | 1 | 2 | 0 |
| Last 30D | 0 | 0 | 0 | 1 | 0 |
| 1M Ago | 0 | 0 | 0 | 0 | 0 |
| 2M Ago | 0 | 0 | 0 | 0 | 0 |
| 3M Ago | 1 | 0 | 1 | 1 | 0 |
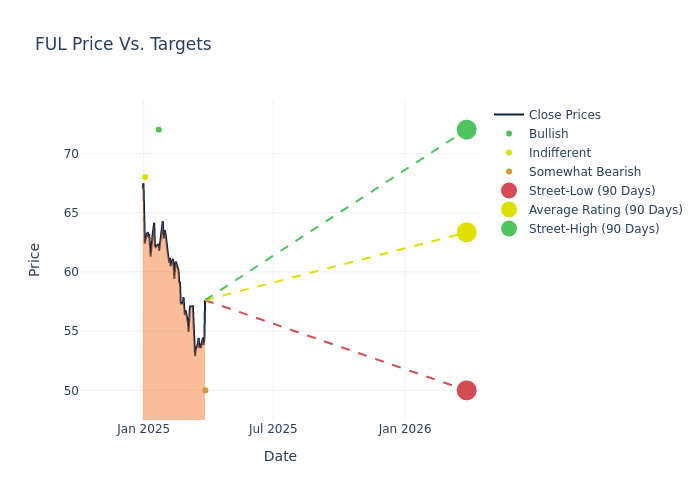
Analysts' evaluations of 12-month price targets offer additional insights, showcasing an average target of $62.5, with a high estimate of $72.00 and a low estimate of $50.00. Observing a downward trend, the current average is 11.66% lower than the prior average price target of $70.75.
Investigating Analyst Ratings: An Elaborate Study
The analysis of recent analyst actions sheds light on the perception of H.B. Fuller by financial experts. The following summary presents key analysts, their recent evaluations, and adjustments to ratings and price targets.
| Analyst | Analyst Firm | Action Taken | Rating | Current Price Target | Prior Price Target |
|---|---|---|---|---|---|
| Jeffrey Zekauskas | JP Morgan | Lowers | Underweight | $50.00 | $60.00 |
| David Begleiter | Deutsche Bank | Lowers | Buy | $72.00 | $75.00 |
| Jeffrey Zekauskas | JP Morgan | Lowers | Underweight | $60.00 | $70.00 |
| Patrick Cunningham | Citigroup | Lowers | Neutral | $68.00 | $78.00 |
Key Insights:
- Action Taken: Responding to changing market dynamics and company performance, analysts update their recommendations. Whether they 'Maintain', 'Raise', or 'Lower' their stance, it signifies their response to recent developments related to H.B. Fuller. This offers insight into analysts' perspectives on the current state of the company.
- Rating: Analysts assign qualitative assessments to stocks, ranging from 'Outperform' to 'Underperform'. These ratings convey the analysts' expectations for the relative performance of H.B. Fuller compared to the broader market.
- Price Targets: Analysts provide insights into price targets, offering estimates for the future value of H.B. Fuller's stock. This comparison reveals trends in analysts' expectations over time.
Analyzing these analyst evaluations alongside relevant financial metrics can provide a comprehensive view of H.B. Fuller's market position. Stay informed and make data-driven decisions with the assistance of our Ratings Table.
Stay up to date on H.B. Fuller analyst ratings.
About H.B. Fuller
H.B. Fuller Co manufactures and sells adhesives, sealants, and other chemical-based products. The company organizes itself into three segments: Hygiene, Health and Consumable Adhesives, Engineering Adhesives and Construction Adhesives. It generates the maximum revenue from hygiene, health and consumable adhesives. This segment produces and supplies a full range of specialty industrial adhesives such as thermoplastic, thermoset, reactive, water-based and solvent-based products for applications in various markets, including packaging , converting, nonwoven and hygiene (disposable diapers, feminine care and medical garments) and health and beauty. The company generates around half of its revenue in the United States.
Key Indicators: H.B. Fuller's Financial Health
Market Capitalization: Indicating a reduced size compared to industry averages, the company's market capitalization poses unique challenges.
Revenue Growth: Over the 3 months period, H.B. Fuller showcased positive performance, achieving a revenue growth rate of 2.26% as of 30 November, 2024. This reflects a substantial increase in the company's top-line earnings. As compared to competitors, the company surpassed expectations with a growth rate higher than the average among peers in the Materials sector.
Net Margin: H.B. Fuller's net margin falls below industry averages, indicating challenges in achieving strong profitability. With a net margin of -0.8%, the company may face hurdles in effective cost management.
Return on Equity (ROE): The company's ROE is below industry benchmarks, signaling potential difficulties in efficiently using equity capital. With an ROE of -0.4%, the company may need to address challenges in generating satisfactory returns for shareholders.
Return on Assets (ROA): H.B. Fuller's ROA falls below industry averages, indicating challenges in efficiently utilizing assets. With an ROA of -0.15%, the company may face hurdles in generating optimal returns from its assets.
Debt Management: H.B. Fuller's debt-to-equity ratio is below the industry average at 1.13, reflecting a lower dependency on debt financing and a more conservative financial approach.
Analyst Ratings: What Are They?
Analysts are specialists within banking and financial systems that typically report for specific stocks or within defined sectors. These people research company financial statements, sit in conference calls and meetings, and speak with relevant insiders to determine what are known as analyst ratings for stocks. Typically, analysts will rate each stock once a quarter.
Analysts may supplement their ratings with predictions for metrics like growth estimates, earnings, and revenue, offering investors a more comprehensive outlook. However, investors should be mindful that analysts, like any human, can have subjective perspectives influencing their forecasts.
Breaking: Wall Street's Next Big Mover
Benzinga's #1 analyst just identified a stock poised for explosive growth. This under-the-radar company could surge 200%+ as major market shifts unfold. Click here for urgent details.
This article was generated by Benzinga's automated content engine and reviewed by an editor.
Edge Rankings
Price Trend
© 2025 Benzinga.com. Benzinga does not provide investment advice. All rights reserved.
date | ticker | name | Price Target | Upside/Downside | Recommendation | Firm |
|---|
Trade confidently with insights and alerts from analyst ratings, free reports and breaking news that affects the stocks you care about.

