
9 analysts have shared their evaluations of Q2 Holdings QTWO during the recent three months, expressing a mix of bullish and bearish perspectives.
The following table summarizes their recent ratings, shedding light on the changing sentiments within the past 30 days and comparing them to the preceding months.
| Bullish | Somewhat Bullish | Indifferent | Somewhat Bearish | Bearish | |
|---|---|---|---|---|---|
| Total Ratings | 4 | 2 | 3 | 0 | 0 |
| Last 30D | 1 | 0 | 0 | 0 | 0 |
| 1M Ago | 0 | 0 | 0 | 0 | 0 |
| 2M Ago | 3 | 2 | 2 | 0 | 0 |
| 3M Ago | 0 | 0 | 1 | 0 | 0 |
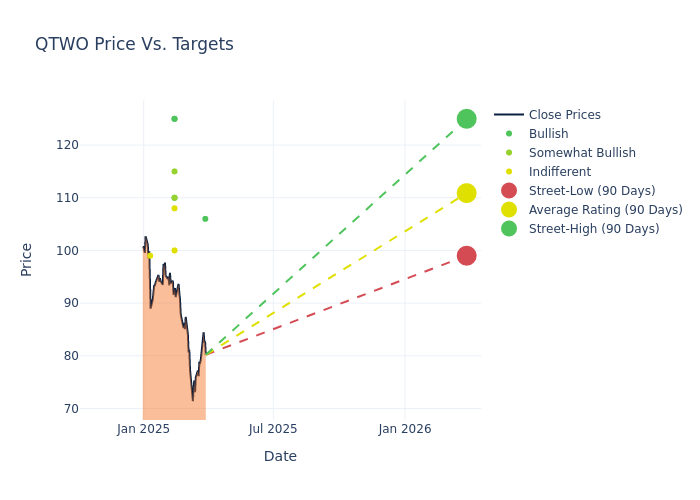
Insights from analysts' 12-month price targets are revealed, presenting an average target of $110.89, a high estimate of $125.00, and a low estimate of $99.00. This upward trend is evident, with the current average reflecting a 4.06% increase from the previous average price target of $106.56.
Analyzing Analyst Ratings: A Detailed Breakdown
The standing of Q2 Holdings among financial experts becomes clear with a thorough analysis of recent analyst actions. The summary below outlines key analysts, their recent evaluations, and adjustments to ratings and price targets.
| Analyst | Analyst Firm | Action Taken | Rating | Current Price Target | Prior Price Target |
|---|---|---|---|---|---|
| Adam Hotchkiss | Goldman Sachs | Lowers | Buy | $106.00 | $119.00 |
| Alexander Sklar | Raymond James | Raises | Outperform | $110.00 | $100.00 |
| Daniel Perlin | RBC Capital | Raises | Sector Perform | $108.00 | $105.00 |
| Charles Nabhan | Stephens & Co. | Maintains | Overweight | $115.00 | $115.00 |
| Andrew Schmidt | Citigroup | Raises | Neutral | $100.00 | $96.00 |
| Parker Lane | Stifel | Raises | Buy | $125.00 | $115.00 |
| Terry Tillman | Truist Securities | Raises | Buy | $110.00 | $100.00 |
| Mayank Tandon | Needham | Raises | Buy | $125.00 | $120.00 |
| Jon Vruwink | Baird | Raises | Neutral | $99.00 | $89.00 |
Key Insights:
- Action Taken: Analysts frequently update their recommendations based on evolving market conditions and company performance. Whether they 'Maintain', 'Raise' or 'Lower' their stance, it reflects their reaction to recent developments related to Q2 Holdings. This information provides a snapshot of how analysts perceive the current state of the company.
- Rating: Offering insights into predictions, analysts assign qualitative values, from 'Outperform' to 'Underperform'. These ratings convey expectations for the relative performance of Q2 Holdings compared to the broader market.
- Price Targets: Analysts predict movements in price targets, offering estimates for Q2 Holdings's future value. Examining the current and prior targets offers insights into analysts' evolving expectations.
For valuable insights into Q2 Holdings's market performance, consider these analyst evaluations alongside crucial financial indicators. Stay well-informed and make prudent decisions using our Ratings Table.
Stay up to date on Q2 Holdings analyst ratings.
Delving into Q2 Holdings's Background
Q2 Holdings Inc. is a provider of cloud-based virtual banking solutions for regional financial institutions to deliver mobile banking services to retail and commercial end-users who wish to bank anywhere and anytime. Its solutions operate on an integrated tablet-first platform which provides financial institutions a comprehensive view of account holder activity and meets the regulatory and security requirements applicable to the industry. The firm generates revenue from subscription-based arrangements for software offerings. A large majority of the firm's revenue is generated in the United States.
Q2 Holdings: A Financial Overview
Market Capitalization Analysis: The company exhibits a lower market capitalization profile, positioning itself below industry averages. This suggests a smaller scale relative to peers.
Revenue Growth: Q2 Holdings's remarkable performance in 3 months is evident. As of 31 December, 2024, the company achieved an impressive revenue growth rate of 12.91%. This signifies a substantial increase in the company's top-line earnings. In comparison to its industry peers, the company trails behind with a growth rate lower than the average among peers in the Information Technology sector.
Net Margin: Q2 Holdings's net margin surpasses industry standards, highlighting the company's exceptional financial performance. With an impressive 0.09% net margin, the company effectively manages costs and achieves strong profitability.
Return on Equity (ROE): The company's ROE is a standout performer, exceeding industry averages. With an impressive ROE of 0.03%, the company showcases effective utilization of equity capital.
Return on Assets (ROA): Q2 Holdings's ROA is below industry standards, pointing towards difficulties in efficiently utilizing assets. With an ROA of 0.01%, the company may encounter challenges in delivering satisfactory returns from its assets.
Debt Management: Q2 Holdings's debt-to-equity ratio surpasses industry norms, standing at 1.05. This suggests the company carries a substantial amount of debt, posing potential financial challenges.
How Are Analyst Ratings Determined?
Benzinga tracks 150 analyst firms and reports on their stock expectations. Analysts typically arrive at their conclusions by predicting how much money a company will make in the future, usually the upcoming five years, and how risky or predictable that company's revenue streams are.
Analysts attend company conference calls and meetings, research company financial statements, and communicate with insiders to publish their ratings on stocks. Analysts typically rate each stock once per quarter or whenever the company has a major update.
Some analysts publish their predictions for metrics such as growth estimates, earnings, and revenue to provide additional guidance with their ratings. When using analyst ratings, it is important to keep in mind that stock and sector analysts are also human and are only offering their opinions to investors.
Which Stocks Are Analysts Recommending Now?
Benzinga Edge gives you instant access to all major analyst upgrades, downgrades, and price targets. Sort by accuracy, upside potential, and more. Click here to stay ahead of the market.
This article was generated by Benzinga's automated content engine and reviewed by an editor.
Edge Rankings
Price Trend
© 2025 Benzinga.com. Benzinga does not provide investment advice. All rights reserved.
date | ticker | name | Price Target | Upside/Downside | Recommendation | Firm |
|---|
Trade confidently with insights and alerts from analyst ratings, free reports and breaking news that affects the stocks you care about.

