
IBM IBM has been analyzed by 14 analysts in the last three months, revealing a diverse range of perspectives from bullish to bearish.
Summarizing their recent assessments, the table below illustrates the evolving sentiments in the past 30 days and compares them to the preceding months.
| Bullish | Somewhat Bullish | Indifferent | Somewhat Bearish | Bearish | |
|---|---|---|---|---|---|
| Total Ratings | 2 | 3 | 8 | 0 | 1 |
| Last 30D | 0 | 0 | 1 | 0 | 0 |
| 1M Ago | 0 | 0 | 0 | 0 | 0 |
| 2M Ago | 1 | 2 | 4 | 0 | 0 |
| 3M Ago | 1 | 1 | 3 | 0 | 1 |
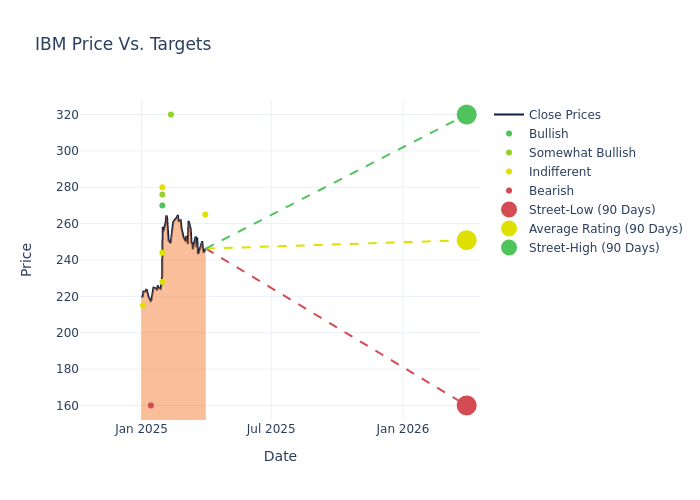
Insights from analysts' 12-month price targets are revealed, presenting an average target of $249.14, a high estimate of $320.00, and a low estimate of $160.00. Surpassing the previous average price target of $234.15, the current average has increased by 6.4%.
Decoding Analyst Ratings: A Detailed Look
The standing of IBM among financial experts becomes clear with a thorough analysis of recent analyst actions. The summary below outlines key analysts, their recent evaluations, and adjustments to ratings and price targets.
| Analyst | Analyst Firm | Action Taken | Rating | Current Price Target | Prior Price Target |
|---|---|---|---|---|---|
| Brent Thill | Jefferies | Lowers | Hold | $265.00 | $270.00 |
| Param Singh | Oppenheimer | Announces | Outperform | $320.00 | - |
| Brian Essex | JP Morgan | Raises | Neutral | $244.00 | $233.00 |
| Brent Thill | Jefferies | Raises | Hold | $270.00 | $245.00 |
| Wamsi Mohan | B of A Securities | Raises | Buy | $270.00 | $260.00 |
| Keith Bachman | BMO Capital | Raises | Market Perform | $280.00 | $260.00 |
| Matthew Swanson | RBC Capital | Raises | Outperform | $276.00 | $250.00 |
| Erik Woodring | Morgan Stanley | Raises | Equal-Weight | $228.00 | $217.00 |
| Erik Woodring | Morgan Stanley | Lowers | Equal-Weight | $217.00 | $222.00 |
| Matthew Hedberg | RBC Capital | Maintains | Outperform | $250.00 | $250.00 |
| Brian Essex | JP Morgan | Raises | Neutral | $233.00 | $227.00 |
| Wamsi Mohan | B of A Securities | Raises | Buy | $260.00 | $250.00 |
| David Vogt | UBS | Raises | Sell | $160.00 | $150.00 |
| Toni Sacconaghi | Bernstein | Raises | Market Perform | $215.00 | $210.00 |
Key Insights:
- Action Taken: Analysts frequently update their recommendations based on evolving market conditions and company performance. Whether they 'Maintain', 'Raise' or 'Lower' their stance, it reflects their reaction to recent developments related to IBM. This information provides a snapshot of how analysts perceive the current state of the company.
- Rating: Offering insights into predictions, analysts assign qualitative values, from 'Outperform' to 'Underperform'. These ratings convey expectations for the relative performance of IBM compared to the broader market.
- Price Targets: Analysts set price targets as an estimate of a stock's future value. Comparing the current and prior price targets provides insight into how analysts' expectations have changed over time. This information can be valuable for investors seeking to understand consensus views on the stock's potential future performance.
Understanding these analyst evaluations alongside key financial indicators can offer valuable insights into IBM's market standing. Stay informed and make well-considered decisions with our Ratings Table.
Stay up to date on IBM analyst ratings.
Unveiling the Story Behind IBM
IBM looks to be a part of every aspect of an enterprise's IT needs. The company primarily sells software, IT services, consulting, and hardware. IBM operates in 175 countries and employs approximately 300,000 people. The company has a robust roster of business partners to service its clients, which include 95% of all Fortune 500 companies. Primary products include its mainframes, Red Hat software, transaction processing software, and IT consulting.
Breaking Down IBM's Financial Performance
Market Capitalization Analysis: With a profound presence, the company's market capitalization is above industry averages. This reflects substantial size and strong market recognition.
Positive Revenue Trend: Examining IBM's financials over 3 months reveals a positive narrative. The company achieved a noteworthy revenue growth rate of 1.0% as of 31 December, 2024, showcasing a substantial increase in top-line earnings. As compared to competitors, the company encountered difficulties, with a growth rate lower than the average among peers in the Information Technology sector.
Net Margin: IBM's net margin excels beyond industry benchmarks, reaching 16.6%. This signifies efficient cost management and strong financial health.
Return on Equity (ROE): The company's ROE is a standout performer, exceeding industry averages. With an impressive ROE of 11.26%, the company showcases effective utilization of equity capital.
Return on Assets (ROA): IBM's ROA stands out, surpassing industry averages. With an impressive ROA of 2.15%, the company demonstrates effective utilization of assets and strong financial performance.
Debt Management: IBM's debt-to-equity ratio surpasses industry norms, standing at 2.14. This suggests the company carries a substantial amount of debt, posing potential financial challenges.
The Significance of Analyst Ratings Explained
Within the domain of banking and financial systems, analysts specialize in reporting for specific stocks or defined sectors. Their work involves attending company conference calls and meetings, researching company financial statements, and communicating with insiders to publish "analyst ratings" for stocks. Analysts typically assess and rate each stock once per quarter.
In addition to their assessments, some analysts extend their insights by offering predictions for key metrics such as earnings, revenue, and growth estimates. This supplementary information provides further guidance for traders. It is crucial to recognize that, despite their specialization, analysts are human and can only provide forecasts based on their beliefs.
Which Stocks Are Analysts Recommending Now?
Benzinga Edge gives you instant access to all major analyst upgrades, downgrades, and price targets. Sort by accuracy, upside potential, and more. Click here to stay ahead of the market.
This article was generated by Benzinga's automated content engine and reviewed by an editor.
Edge Rankings
Price Trend
© 2025 Benzinga.com. Benzinga does not provide investment advice. All rights reserved.
date | ticker | name | Price Target | Upside/Downside | Recommendation | Firm |
|---|
Trade confidently with insights and alerts from analyst ratings, free reports and breaking news that affects the stocks you care about.

