


In the last three months, 7 analysts have published ratings on Janus Henderson Group JHG, offering a diverse range of perspectives from bullish to bearish.
Summarizing their recent assessments, the table below illustrates the evolving sentiments in the past 30 days and compares them to the preceding months.
| Bullish | Somewhat Bullish | Indifferent | Somewhat Bearish | Bearish | |
|---|---|---|---|---|---|
| Total Ratings | 2 | 1 | 4 | 0 | 0 |
| Last 30D | 1 | 0 | 0 | 0 | 0 |
| 1M Ago | 0 | 0 | 0 | 0 | 0 |
| 2M Ago | 1 | 1 | 2 | 0 | 0 |
| 3M Ago | 0 | 0 | 2 | 0 | 0 |
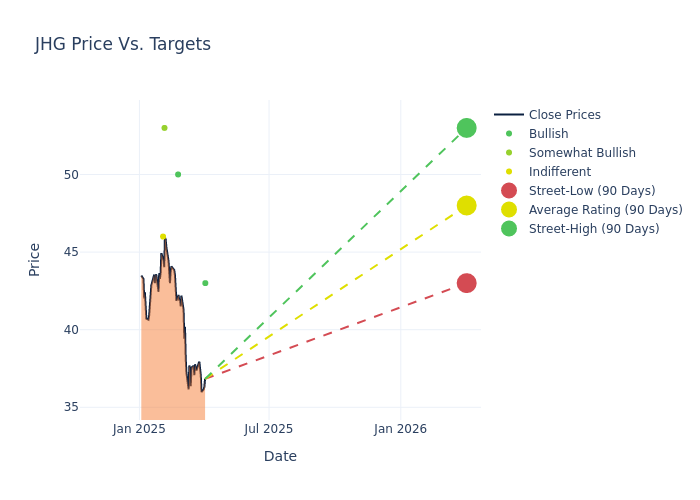
The 12-month price targets, analyzed by analysts, offer insights with an average target of $46.29, a high estimate of $53.00, and a low estimate of $43.00. Surpassing the previous average price target of $45.86, the current average has increased by 0.94%.
Interpreting Analyst Ratings: A Closer Look
The analysis of recent analyst actions sheds light on the perception of Janus Henderson Group by financial experts. The following summary presents key analysts, their recent evaluations, and adjustments to ratings and price targets.
| Analyst | Analyst Firm | Action Taken | Rating | Current Price Target | Prior Price Target |
|---|---|---|---|---|---|
| Craig Siegenthaler | B of A Securities | Lowers | Buy | $43.00 | $57.00 |
| Brennan Hawken | UBS | Raises | Buy | $50.00 | $45.00 |
| Kenneth Worthington | JP Morgan | Raises | Overweight | $53.00 | $44.00 |
| Brennan Hawken | UBS | Raises | Neutral | $45.00 | $42.00 |
| Michael Brown | Wells Fargo | Raises | Equal-Weight | $46.00 | $43.00 |
| Michael Brown | Wells Fargo | Lowers | Equal-Weight | $43.00 | $45.00 |
| Kenneth Worthington | JP Morgan | Lowers | Neutral | $44.00 | $45.00 |
Key Insights:
- Action Taken: In response to dynamic market conditions and company performance, analysts update their recommendations. Whether they 'Maintain', 'Raise', or 'Lower' their stance, it signifies their reaction to recent developments related to Janus Henderson Group. This insight gives a snapshot of analysts' perspectives on the current state of the company.
- Rating: Gaining insights, analysts provide qualitative assessments, ranging from 'Outperform' to 'Underperform'. These ratings reflect expectations for the relative performance of Janus Henderson Group compared to the broader market.
- Price Targets: Delving into movements, analysts provide estimates for the future value of Janus Henderson Group's stock. This analysis reveals shifts in analysts' expectations over time.
Considering these analyst evaluations in conjunction with other financial indicators can offer a comprehensive understanding of Janus Henderson Group's market position. Stay informed and make well-informed decisions with our Ratings Table.
Stay up to date on Janus Henderson Group analyst ratings.
About Janus Henderson Group
Janus Henderson Group provides investment management services to retail intermediary (56% of managed assets), self-directed (23%) and institutional (21%) clients. At the end of September 2024, active equities (63%), fixed-income (21%), multi-asset (14%) and alternative (2%) investment platforms constituted the company's $382.3 billion in assets under management. Janus Henderson sources most of its managed assets from clients in North America (61%), with customers from Europe, the Middle East, Africa, and Latin America (29%) and the Asia-Pacific region (10%) accounting for the remainder.
Breaking Down Janus Henderson Group's Financial Performance
Market Capitalization Analysis: Falling below industry benchmarks, the company's market capitalization reflects a reduced size compared to peers. This positioning may be influenced by factors such as growth expectations or operational capacity.
Positive Revenue Trend: Examining Janus Henderson Group's financials over 3 months reveals a positive narrative. The company achieved a noteworthy revenue growth rate of 24.59% as of 31 December, 2024, showcasing a substantial increase in top-line earnings. When compared to others in the Financials sector, the company excelled with a growth rate higher than the average among peers.
Net Margin: Janus Henderson Group's net margin falls below industry averages, indicating challenges in achieving strong profitability. With a net margin of 18.16%, the company may face hurdles in effective cost management.
Return on Equity (ROE): Janus Henderson Group's ROE lags behind industry averages, suggesting challenges in maximizing returns on equity capital. With an ROE of 2.79%, the company may face hurdles in achieving optimal financial performance.
Return on Assets (ROA): Janus Henderson Group's ROA surpasses industry standards, highlighting the company's exceptional financial performance. With an impressive 1.81% ROA, the company effectively utilizes its assets for optimal returns.
Debt Management: Janus Henderson Group's debt-to-equity ratio is below the industry average. With a ratio of 0.11, the company relies less on debt financing, maintaining a healthier balance between debt and equity, which can be viewed positively by investors.
Analyst Ratings: Simplified
Analyst ratings serve as essential indicators of stock performance, provided by experts in banking and financial systems. These specialists diligently analyze company financial statements, participate in conference calls, and engage with insiders to generate quarterly ratings for individual stocks.
Some analysts publish their predictions for metrics such as growth estimates, earnings, and revenue to provide additional guidance with their ratings. When using analyst ratings, it is important to keep in mind that stock and sector analysts are also human and are only offering their opinions to investors.
If you want to keep track of which analysts are outperforming others, you can view updated analyst ratings along withanalyst success scores in Benzinga Pro.
Breaking: Wall Street's Next Big Mover
Benzinga's #1 analyst just identified a stock poised for explosive growth. This under-the-radar company could surge 200%+ as major market shifts unfold. Click here for urgent details.
This article was generated by Benzinga's automated content engine and reviewed by an editor.
Edge Rankings
Price Trend
© 2025 Benzinga.com. Benzinga does not provide investment advice. All rights reserved.
date | ticker | name | Price Target | Upside/Downside | Recommendation | Firm |
|---|
Trade confidently with insights and alerts from analyst ratings, free reports and breaking news that affects the stocks you care about.

