


Providing a diverse range of perspectives from bullish to bearish, 10 analysts have published ratings on Albertsons Companies ACI in the last three months.
In the table below, you'll find a summary of their recent ratings, revealing the shifting sentiments over the past 30 days and comparing them to the previous months.
| Bullish | Somewhat Bullish | Indifferent | Somewhat Bearish | Bearish | |
|---|---|---|---|---|---|
| Total Ratings | 2 | 7 | 1 | 0 | 0 |
| Last 30D | 0 | 1 | 0 | 0 | 0 |
| 1M Ago | 0 | 3 | 1 | 0 | 0 |
| 2M Ago | 1 | 0 | 0 | 0 | 0 |
| 3M Ago | 1 | 3 | 0 | 0 | 0 |
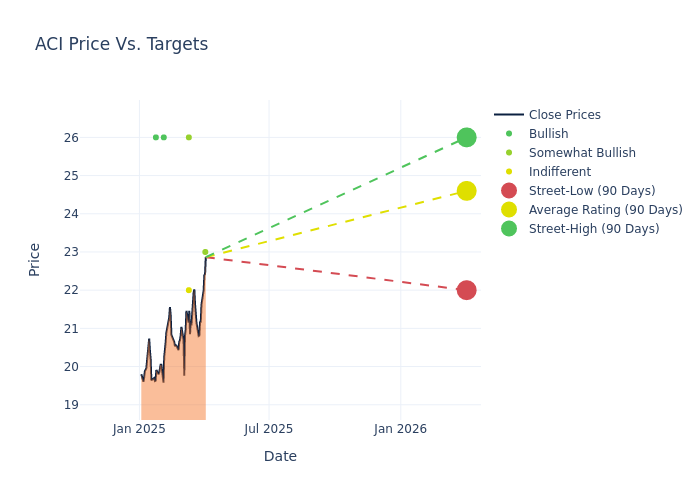
Providing deeper insights, analysts have established 12-month price targets, indicating an average target of $24.2, along with a high estimate of $26.00 and a low estimate of $22.00. This current average has increased by 2.98% from the previous average price target of $23.50.
Interpreting Analyst Ratings: A Closer Look
A comprehensive examination of how financial experts perceive Albertsons Companies is derived from recent analyst actions. The following is a detailed summary of key analysts, their recent evaluations, and adjustments to ratings and price targets.
| Analyst | Analyst Firm | Action Taken | Rating | Current Price Target | Prior Price Target |
|---|---|---|---|---|---|
| Steven Shemesh | RBC Capital | Maintains | Outperform | $23.00 | $23.00 |
| Steven Shemesh | RBC Capital | Raises | Outperform | $23.00 | $22.00 |
| Michael Montani | Evercore ISI Group | Raises | In-Line | $22.00 | $21.00 |
| Joe Feldman | Telsey Advisory Group | Maintains | Outperform | $26.00 | $26.00 |
| Joe Feldman | Telsey Advisory Group | Maintains | Outperform | $26.00 | $26.00 |
| Leah Jordan | Goldman Sachs | Announces | Buy | $26.00 | - |
| Paul Lejuez | Citigroup | Announces | Buy | $26.00 | - |
| Steven Shemesh | RBC Capital | Maintains | Outperform | $22.00 | $22.00 |
| Joe Feldman | Telsey Advisory Group | Maintains | Outperform | $26.00 | $26.00 |
| Steven Shemesh | RBC Capital | Maintains | Outperform | $22.00 | $22.00 |
Key Insights:
- Action Taken: Responding to changing market dynamics and company performance, analysts update their recommendations. Whether they 'Maintain', 'Raise', or 'Lower' their stance, it signifies their response to recent developments related to Albertsons Companies. This offers insight into analysts' perspectives on the current state of the company.
- Rating: Analysts unravel qualitative evaluations for stocks, ranging from 'Outperform' to 'Underperform'. These ratings offer insights into expectations for the relative performance of Albertsons Companies compared to the broader market.
- Price Targets: Analysts navigate through adjustments in price targets, providing estimates for Albertsons Companies's future value. Comparing current and prior targets offers insights into analysts' evolving expectations.
Assessing these analyst evaluations alongside crucial financial indicators can provide a comprehensive overview of Albertsons Companies's market position. Stay informed and make well-judged decisions with the assistance of our Ratings Table.
Stay up to date on Albertsons Companies analyst ratings.
About Albertsons Companies
Albertsons is the second largest supermarket operator in the United States with more than 2,200 stores across a variety of banners. About 80% of the firm's sales stem from non-perishable and fresh food, of which 25% comes from its portfolio of private brands. The company operates fuel centers and pharmacies at about 20% and 75% of its store locations, respectively. Albertsons went public in 2020 following years of ownership under private equity firm Cerberus Capital Management, which still owns about a fourth of outstanding shares.
Breaking Down Albertsons Companies's Financial Performance
Market Capitalization: Exceeding industry standards, the company's market capitalization places it above industry average in size relative to peers. This emphasizes its significant scale and robust market position.
Positive Revenue Trend: Examining Albertsons Companies's financials over 3 months reveals a positive narrative. The company achieved a noteworthy revenue growth rate of 1.17% as of 30 November, 2024, showcasing a substantial increase in top-line earnings. When compared to others in the Consumer Staples sector, the company faces challenges, achieving a growth rate lower than the average among peers.
Net Margin: Albertsons Companies's financial strength is reflected in its exceptional net margin, which exceeds industry averages. With a remarkable net margin of 2.13%, the company showcases strong profitability and effective cost management.
Return on Equity (ROE): Albertsons Companies's ROE surpasses industry standards, highlighting the company's exceptional financial performance. With an impressive 12.55% ROE, the company effectively utilizes shareholder equity capital.
Return on Assets (ROA): Albertsons Companies's financial strength is reflected in its exceptional ROA, which exceeds industry averages. With a remarkable ROA of 1.51%, the company showcases efficient use of assets and strong financial health.
Debt Management: Albertsons Companies's debt-to-equity ratio surpasses industry norms, standing at 4.22. This suggests the company carries a substantial amount of debt, posing potential financial challenges.
Understanding the Relevance of Analyst Ratings
Analysts are specialists within banking and financial systems that typically report for specific stocks or within defined sectors. These people research company financial statements, sit in conference calls and meetings, and speak with relevant insiders to determine what are known as analyst ratings for stocks. Typically, analysts will rate each stock once a quarter.
Some analysts publish their predictions for metrics such as growth estimates, earnings, and revenue to provide additional guidance with their ratings. When using analyst ratings, it is important to keep in mind that stock and sector analysts are also human and are only offering their opinions to investors.
If you want to keep track of which analysts are outperforming others, you can view updated analyst ratings along withanalyst success scores in Benzinga Pro.
Which Stocks Are Analysts Recommending Now?
Benzinga Edge gives you instant access to all major analyst upgrades, downgrades, and price targets. Sort by accuracy, upside potential, and more. Click here to stay ahead of the market.
This article was generated by Benzinga's automated content engine and reviewed by an editor.
Edge Rankings
Price Trend
© 2025 Benzinga.com. Benzinga does not provide investment advice. All rights reserved.
date | ticker | name | Price Target | Upside/Downside | Recommendation | Firm |
|---|
Trade confidently with insights and alerts from analyst ratings, free reports and breaking news that affects the stocks you care about.

