


Realty Income O has been analyzed by 9 analysts in the last three months, revealing a diverse range of perspectives from bullish to bearish.
Summarizing their recent assessments, the table below illustrates the evolving sentiments in the past 30 days and compares them to the preceding months.
| Bullish | Somewhat Bullish | Indifferent | Somewhat Bearish | Bearish | |
|---|---|---|---|---|---|
| Total Ratings | 1 | 2 | 6 | 0 | 0 |
| Last 30D | 0 | 0 | 1 | 0 | 0 |
| 1M Ago | 0 | 0 | 1 | 0 | 0 |
| 2M Ago | 0 | 1 | 2 | 0 | 0 |
| 3M Ago | 1 | 1 | 2 | 0 | 0 |
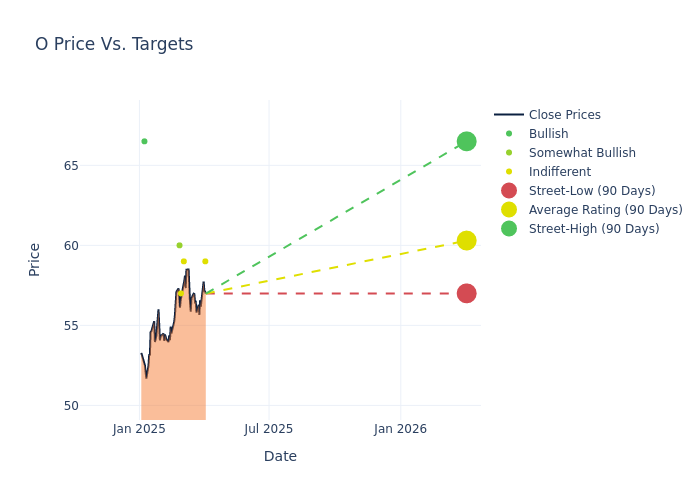
Analysts provide deeper insights through their assessments of 12-month price targets, revealing an average target of $59.17, a high estimate of $66.50, and a low estimate of $54.00. This current average represents a 1.92% decrease from the previous average price target of $60.33.
Analyzing Analyst Ratings: A Detailed Breakdown
The standing of Realty Income among financial experts becomes clear with a thorough analysis of recent analyst actions. The summary below outlines key analysts, their recent evaluations, and adjustments to ratings and price targets.
| Analyst | Analyst Firm | Action Taken | Rating | Current Price Target | Prior Price Target |
|---|---|---|---|---|---|
| Haendel St. Juste | Mizuho | Raises | Neutral | $59.00 | $54.00 |
| Richard Hightower | Barclays | Raises | Equal-Weight | $59.00 | $56.00 |
| Nicholas Yulico | Scotiabank | Lowers | Sector Perform | $57.00 | $59.00 |
| Brad Heffern | RBC Capital | Lowers | Outperform | $60.00 | $62.00 |
| Richard Hightower | Barclays | Lowers | Equal-Weight | $56.00 | $59.00 |
| Brad Heffern | RBC Capital | Maintains | Outperform | $62.00 | $62.00 |
| Nicholas Yulico | Scotiabank | Lowers | Sector Perform | $59.00 | $61.00 |
| Simon Yarmak | Stifel | Lowers | Buy | $66.50 | $70.00 |
| Vikram Malhorta | Mizuho | Lowers | Neutral | $54.00 | $60.00 |
Key Insights:
- Action Taken: Analysts adapt their recommendations to changing market conditions and company performance. Whether they 'Maintain', 'Raise' or 'Lower' their stance, it reflects their response to recent developments related to Realty Income. This information provides a snapshot of how analysts perceive the current state of the company.
- Rating: Offering a comprehensive view, analysts assess stocks qualitatively, spanning from 'Outperform' to 'Underperform'. These ratings convey expectations for the relative performance of Realty Income compared to the broader market.
- Price Targets: Understanding forecasts, analysts offer estimates for Realty Income's future value. Examining the current and prior targets provides insight into analysts' changing expectations.
Understanding these analyst evaluations alongside key financial indicators can offer valuable insights into Realty Income's market standing. Stay informed and make well-considered decisions with our Ratings Table.
Stay up to date on Realty Income analyst ratings.
All You Need to Know About Realty Income
Realty Income owns roughly 15,600 properties, most of which are freestanding, single-tenant, triple-net-leased retail properties. Its properties are located in 49 states and Puerto Rico and are leased to 250 tenants from 47 industries. Recent acquisitions have added industrial, gaming, office, manufacturing, and distribution properties, which make up roughly 20% of revenue.
Financial Insights: Realty Income
Market Capitalization Analysis: The company's market capitalization surpasses industry averages, showcasing a dominant size relative to peers and suggesting a strong market position.
Revenue Growth: Over the 3 months period, Realty Income showcased positive performance, achieving a revenue growth rate of 24.53% as of 31 December, 2024. This reflects a substantial increase in the company's top-line earnings. In comparison to its industry peers, the company stands out with a growth rate higher than the average among peers in the Real Estate sector.
Net Margin: Realty Income's net margin lags behind industry averages, suggesting challenges in maintaining strong profitability. With a net margin of 14.89%, the company may face hurdles in effective cost management.
Return on Equity (ROE): Realty Income's ROE falls below industry averages, indicating challenges in efficiently using equity capital. With an ROE of 0.52%, the company may face hurdles in generating optimal returns for shareholders.
Return on Assets (ROA): Realty Income's ROA falls below industry averages, indicating challenges in efficiently utilizing assets. With an ROA of 0.29%, the company may face hurdles in generating optimal returns from its assets.
Debt Management: With a below-average debt-to-equity ratio of 0.69, Realty Income adopts a prudent financial strategy, indicating a balanced approach to debt management.
Understanding the Relevance of Analyst Ratings
Ratings come from analysts, or specialists within banking and financial systems that report for specific stocks or defined sectors (typically once per quarter for each stock). Analysts usually derive their information from company conference calls and meetings, financial statements, and conversations with important insiders to reach their decisions.
Beyond their standard evaluations, some analysts contribute predictions for metrics like growth estimates, earnings, and revenue, furnishing investors with additional guidance. Users of analyst ratings should be mindful that this specialized advice is shaped by human perspectives and may be subject to variability.
Which Stocks Are Analysts Recommending Now?
Benzinga Edge gives you instant access to all major analyst upgrades, downgrades, and price targets. Sort by accuracy, upside potential, and more. Click here to stay ahead of the market.
This article was generated by Benzinga's automated content engine and reviewed by an editor.
Edge Rankings
Price Trend
© 2025 Benzinga.com. Benzinga does not provide investment advice. All rights reserved.
date | ticker | name | Price Target | Upside/Downside | Recommendation | Firm |
|---|
Trade confidently with insights and alerts from analyst ratings, free reports and breaking news that affects the stocks you care about.

