


RxSight RXST underwent analysis by 12 analysts in the last quarter, revealing a spectrum of viewpoints from bullish to bearish.
The table below provides a snapshot of their recent ratings, showcasing how sentiments have evolved over the past 30 days and comparing them to the preceding months.
| Bullish | Somewhat Bullish | Indifferent | Somewhat Bearish | Bearish | |
|---|---|---|---|---|---|
| Total Ratings | 4 | 1 | 6 | 1 | 0 |
| Last 30D | 0 | 0 | 0 | 1 | 0 |
| 1M Ago | 2 | 0 | 2 | 0 | 0 |
| 2M Ago | 1 | 1 | 2 | 0 | 0 |
| 3M Ago | 1 | 0 | 2 | 0 | 0 |
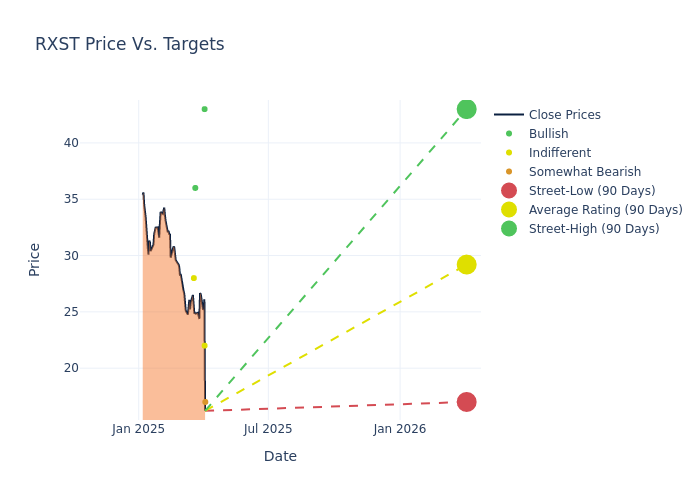
The 12-month price targets assessed by analysts reveal further insights, featuring an average target of $36.5, a high estimate of $66.00, and a low estimate of $17.00. Experiencing a 18.74% decline, the current average is now lower than the previous average price target of $44.92.
Understanding Analyst Ratings: A Comprehensive Breakdown
In examining recent analyst actions, we gain insights into how financial experts perceive RxSight. The following summary outlines key analysts, their recent evaluations, and adjustments to ratings and price targets.
| Analyst | Analyst Firm | Action Taken | Rating | Current Price Target | Prior Price Target |
|---|---|---|---|---|---|
| Robbie Marcus | JP Morgan | Lowers | Underweight | $17.00 | $40.00 |
| Larry Biegelsen | Wells Fargo | Lowers | Equal-Weight | $22.00 | $35.00 |
| David Saxon | Needham | Maintains | Buy | $43.00 | $43.00 |
| Craig Bijou | B of A Securities | Lowers | Buy | $36.00 | $60.00 |
| Thomas Stephan | Stifel | Lowers | Hold | $28.00 | $33.00 |
| Robbie Marcus | JP Morgan | Lowers | Overweight | $40.00 | $62.00 |
| Thomas Stephan | Stifel | Lowers | Hold | $33.00 | $35.00 |
| Larry Biegelsen | Wells Fargo | Lowers | Equal-Weight | $35.00 | $40.00 |
| David Saxon | Needham | Maintains | Buy | $43.00 | $43.00 |
| Larry Biegelsen | Wells Fargo | Lowers | Equal-Weight | $40.00 | $42.00 |
| Thomas Stephan | Stifel | Lowers | Hold | $35.00 | $40.00 |
| David Saxon | Needham | Maintains | Buy | $66.00 | $66.00 |
Key Insights:
- Action Taken: Responding to changing market dynamics and company performance, analysts update their recommendations. Whether they 'Maintain', 'Raise', or 'Lower' their stance, it signifies their response to recent developments related to RxSight. This offers insight into analysts' perspectives on the current state of the company.
- Rating: Gaining insights, analysts provide qualitative assessments, ranging from 'Outperform' to 'Underperform'. These ratings reflect expectations for the relative performance of RxSight compared to the broader market.
- Price Targets: Analysts explore the dynamics of price targets, providing estimates for the future value of RxSight's stock. This examination reveals shifts in analysts' expectations over time.
Capture valuable insights into RxSight's market standing by understanding these analyst evaluations alongside pertinent financial indicators. Stay informed and make strategic decisions with our Ratings Table.
Stay up to date on RxSight analyst ratings.
If you are interested in following small-cap stock news and performance you can start by tracking it here.
Delving into RxSight's Background
RxSight Inc is a commercial-stage medical technology company dedicated towards improving the vision of patients following cataract surgery. It offers intraocular lens technology that enables doctors to customize and optimize visual acuity for patients after cataract surgery. The company operates and manages its business in one reportable segment, the research and development, manufacture and sale of light adjustable lenses and related capital equipment.
RxSight: Delving into Financials
Market Capitalization Perspectives: The company's market capitalization falls below industry averages, signaling a relatively smaller size compared to peers. This positioning may be influenced by factors such as perceived growth potential or operational scale.
Revenue Growth: RxSight displayed positive results in 3 months. As of 31 December, 2024, the company achieved a solid revenue growth rate of approximately 40.71%. This indicates a notable increase in the company's top-line earnings. When compared to others in the Health Care sector, the company excelled with a growth rate higher than the average among peers.
Net Margin: RxSight's net margin surpasses industry standards, highlighting the company's exceptional financial performance. With an impressive -14.77% net margin, the company effectively manages costs and achieves strong profitability.
Return on Equity (ROE): RxSight's financial strength is reflected in its exceptional ROE, which exceeds industry averages. With a remarkable ROE of -2.13%, the company showcases efficient use of equity capital and strong financial health.
Return on Assets (ROA): RxSight's financial strength is reflected in its exceptional ROA, which exceeds industry averages. With a remarkable ROA of -1.89%, the company showcases efficient use of assets and strong financial health.
Debt Management: RxSight's debt-to-equity ratio is below industry norms, indicating a sound financial structure with a ratio of 0.04.
Understanding the Relevance of Analyst Ratings
Analysts are specialists within banking and financial systems that typically report for specific stocks or within defined sectors. These people research company financial statements, sit in conference calls and meetings, and speak with relevant insiders to determine what are known as analyst ratings for stocks. Typically, analysts will rate each stock once a quarter.
In addition to their assessments, some analysts extend their insights by offering predictions for key metrics such as earnings, revenue, and growth estimates. This supplementary information provides further guidance for traders. It is crucial to recognize that, despite their specialization, analysts are human and can only provide forecasts based on their beliefs.
Breaking: Wall Street's Next Big Mover
Benzinga's #1 analyst just identified a stock poised for explosive growth. This under-the-radar company could surge 200%+ as major market shifts unfold. Click here for urgent details.
This article was generated by Benzinga's automated content engine and reviewed by an editor.
Edge Rankings
Price Trend
© 2025 Benzinga.com. Benzinga does not provide investment advice. All rights reserved.
date | ticker | name | Price Target | Upside/Downside | Recommendation | Firm |
|---|
Trade confidently with insights and alerts from analyst ratings, free reports and breaking news that affects the stocks you care about.

