


Patrick Industries PATK underwent analysis by 6 analysts in the last quarter, revealing a spectrum of viewpoints from bullish to bearish.
The following table encapsulates their recent ratings, offering a glimpse into the evolving sentiments over the past 30 days and comparing them to the preceding months.
| Bullish | Somewhat Bullish | Indifferent | Somewhat Bearish | Bearish | |
|---|---|---|---|---|---|
| Total Ratings | 3 | 2 | 1 | 0 | 0 |
| Last 30D | 0 | 0 | 1 | 0 | 0 |
| 1M Ago | 0 | 0 | 0 | 0 | 0 |
| 2M Ago | 2 | 2 | 0 | 0 | 0 |
| 3M Ago | 1 | 0 | 0 | 0 | 0 |
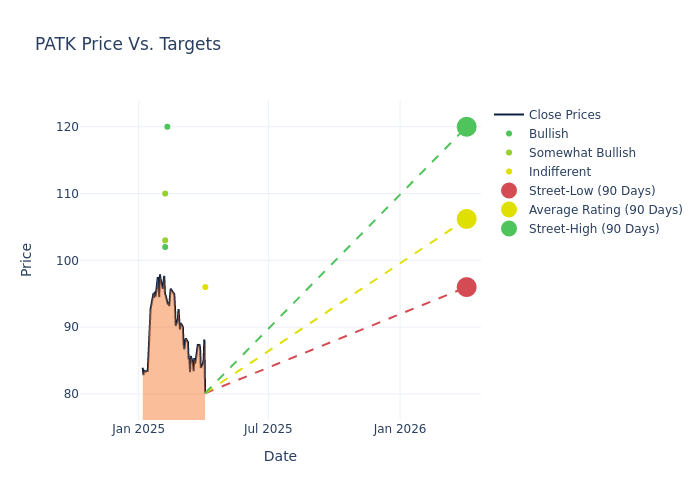
In the assessment of 12-month price targets, analysts unveil insights for Patrick Industries, presenting an average target of $106.0, a high estimate of $120.00, and a low estimate of $96.00. Surpassing the previous average price target of $103.67, the current average has increased by 2.25%.
Investigating Analyst Ratings: An Elaborate Study
The analysis of recent analyst actions sheds light on the perception of Patrick Industries by financial experts. The following summary presents key analysts, their recent evaluations, and adjustments to ratings and price targets.
| Analyst | Analyst Firm | Action Taken | Rating | Current Price Target | Prior Price Target |
|---|---|---|---|---|---|
| Craig Kennison | Baird | Lowers | Neutral | $96.00 | $100.00 |
| Michael Swartz | Truist Securities | Raises | Buy | $120.00 | $115.00 |
| Michael Albanese | Benchmark | Raises | Buy | $102.00 | $98.00 |
| Joseph Altobello | Raymond James | Raises | Outperform | $103.00 | $99.00 |
| Noah Zatzkin | Keybanc | Raises | Overweight | $110.00 | $100.00 |
| Michael Swartz | Truist Securities | Lowers | Buy | $105.00 | $110.00 |
Key Insights:
- Action Taken: Analysts frequently update their recommendations based on evolving market conditions and company performance. Whether they 'Maintain', 'Raise' or 'Lower' their stance, it reflects their reaction to recent developments related to Patrick Industries. This information provides a snapshot of how analysts perceive the current state of the company.
- Rating: Offering a comprehensive view, analysts assess stocks qualitatively, spanning from 'Outperform' to 'Underperform'. These ratings convey expectations for the relative performance of Patrick Industries compared to the broader market.
- Price Targets: Analysts set price targets as an estimate of a stock's future value. Comparing the current and prior price targets provides insight into how analysts' expectations have changed over time. This information can be valuable for investors seeking to understand consensus views on the stock's potential future performance.
Understanding these analyst evaluations alongside key financial indicators can offer valuable insights into Patrick Industries's market standing. Stay informed and make well-considered decisions with our Ratings Table.
Stay up to date on Patrick Industries analyst ratings.
About Patrick Industries
Patrick Industries Inc makes and sells building products and materials for recreational vehicles and manufactured housing. The company is organized into two segments based on product type: manufacturing and distribution. The manufacturing segment, which generates the majority of revenue, sells laminated and vinyl products that include furniture, shelving, cabinets, bath fixtures, and countertops. The distribution segment sells prefinished wall and ceiling panels, as well as electrical and plumbing products for the RV and manufactured housing industries. One of the firm's RV customers makes up a portion of revenue.
Patrick Industries's Financial Performance
Market Capitalization: Positioned above industry average, the company's market capitalization underscores its superiority in size, indicative of a strong market presence.
Revenue Growth: Patrick Industries's revenue growth over a period of 3 months has been noteworthy. As of 31 December, 2024, the company achieved a revenue growth rate of approximately 8.31%. This indicates a substantial increase in the company's top-line earnings. As compared to competitors, the company surpassed expectations with a growth rate higher than the average among peers in the Consumer Discretionary sector.
Net Margin: Patrick Industries's net margin surpasses industry standards, highlighting the company's exceptional financial performance. With an impressive 1.72% net margin, the company effectively manages costs and achieves strong profitability.
Return on Equity (ROE): Patrick Industries's ROE surpasses industry standards, highlighting the company's exceptional financial performance. With an impressive 1.29% ROE, the company effectively utilizes shareholder equity capital.
Return on Assets (ROA): Patrick Industries's ROA lags behind industry averages, suggesting challenges in maximizing returns from its assets. With an ROA of 0.47%, the company may face hurdles in achieving optimal financial performance.
Debt Management: Patrick Industries's debt-to-equity ratio surpasses industry norms, standing at 1.35. This suggests the company carries a substantial amount of debt, posing potential financial challenges.
Analyst Ratings: Simplified
Analysts are specialists within banking and financial systems that typically report for specific stocks or within defined sectors. These people research company financial statements, sit in conference calls and meetings, and speak with relevant insiders to determine what are known as analyst ratings for stocks. Typically, analysts will rate each stock once a quarter.
Analysts may supplement their ratings with predictions for metrics like growth estimates, earnings, and revenue, offering investors a more comprehensive outlook. However, investors should be mindful that analysts, like any human, can have subjective perspectives influencing their forecasts.
Which Stocks Are Analysts Recommending Now?
Benzinga Edge gives you instant access to all major analyst upgrades, downgrades, and price targets. Sort by accuracy, upside potential, and more. Click here to stay ahead of the market.
This article was generated by Benzinga's automated content engine and reviewed by an editor.
Edge Rankings
Price Trend
© 2025 Benzinga.com. Benzinga does not provide investment advice. All rights reserved.
date | ticker | name | Price Target | Upside/Downside | Recommendation | Firm |
|---|
Trade confidently with insights and alerts from analyst ratings, free reports and breaking news that affects the stocks you care about.

