


Throughout the last three months, 22 analysts have evaluated Nike NKE, offering a diverse set of opinions from bullish to bearish.
Summarizing their recent assessments, the table below illustrates the evolving sentiments in the past 30 days and compares them to the preceding months.
| Bullish | Somewhat Bullish | Indifferent | Somewhat Bearish | Bearish | |
|---|---|---|---|---|---|
| Total Ratings | 6 | 5 | 11 | 0 | 0 |
| Last 30D | 0 | 0 | 1 | 0 | 0 |
| 1M Ago | 3 | 3 | 7 | 0 | 0 |
| 2M Ago | 3 | 1 | 3 | 0 | 0 |
| 3M Ago | 0 | 1 | 0 | 0 | 0 |
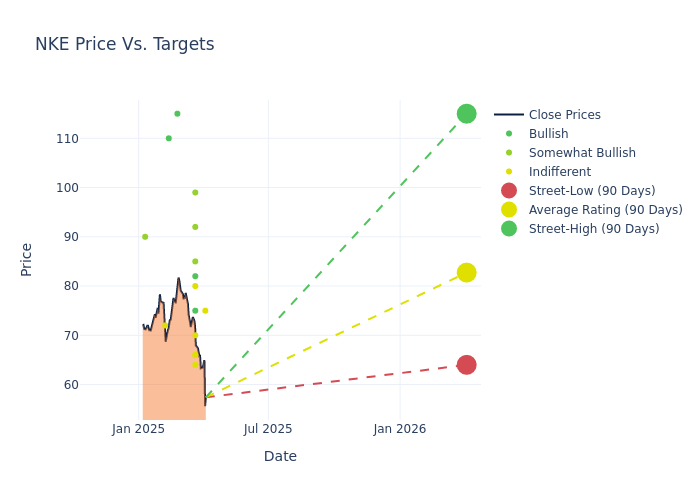
Analysts have set 12-month price targets for Nike, revealing an average target of $82.36, a high estimate of $115.00, and a low estimate of $64.00. Observing a downward trend, the current average is 1.15% lower than the prior average price target of $83.32.
Understanding Analyst Ratings: A Comprehensive Breakdown
A comprehensive examination of how financial experts perceive Nike is derived from recent analyst actions. The following is a detailed summary of key analysts, their recent evaluations, and adjustments to ratings and price targets.
| Analyst | Analyst Firm | Action Taken | Rating | Current Price Target | Prior Price Target |
|---|---|---|---|---|---|
| Jim Duffy | Stifel | Maintains | Hold | $75.00 | $75.00 |
| Alex Straton | Morgan Stanley | Lowers | Equal-Weight | $70.00 | $72.00 |
| Piral Dadhania | RBC Capital | Lowers | Sector Perform | $66.00 | $67.00 |
| Matthew Boss | JP Morgan | Lowers | Neutral | $64.00 | $73.00 |
| Jay Sole | UBS | Lowers | Neutral | $66.00 | $73.00 |
| Simeon Siegel | BMO Capital | Lowers | Outperform | $92.00 | $95.00 |
| Joseph Civello | Truist Securities | Lowers | Buy | $82.00 | $90.00 |
| Ike Boruchow | Wells Fargo | Lowers | Overweight | $85.00 | $90.00 |
| Jonathan Komp | Baird | Lowers | Outperform | $99.00 | $105.00 |
| Cristina Fernandez | Telsey Advisory Group | Maintains | Market Perform | $80.00 | $80.00 |
| Tom Nikic | Needham | Lowers | Buy | $75.00 | $80.00 |
| Tom Nikic | Needham | Lowers | Buy | $80.00 | $84.00 |
| Cristina Fernandez | Telsey Advisory Group | Maintains | Market Perform | $80.00 | $80.00 |
| Alex Straton | Morgan Stanley | Lowers | Equal-Weight | $72.00 | $74.00 |
| Randal Konik | Jefferies | Raises | Buy | $115.00 | $75.00 |
| Cristina Fernandez | Telsey Advisory Group | Maintains | Market Perform | $80.00 | $80.00 |
| Robert Drbul | Guggenheim | Maintains | Buy | $110.00 | $110.00 |
| Tom Nikic | Needham | Maintains | Buy | $84.00 | $84.00 |
| Paul Lejuez | Citigroup | Lowers | Neutral | $72.00 | $102.00 |
| Cristina Fernandez | Telsey Advisory Group | Maintains | Market Perform | $80.00 | $80.00 |
| Simeon Siegel | BMO Capital | Raises | Outperform | $95.00 | $92.00 |
| Anna Andreeva | Piper Sandler | Raises | Overweight | $90.00 | $72.00 |
Key Insights:
- Action Taken: Analysts frequently update their recommendations based on evolving market conditions and company performance. Whether they 'Maintain', 'Raise' or 'Lower' their stance, it reflects their reaction to recent developments related to Nike. This information provides a snapshot of how analysts perceive the current state of the company.
- Rating: Gaining insights, analysts provide qualitative assessments, ranging from 'Outperform' to 'Underperform'. These ratings reflect expectations for the relative performance of Nike compared to the broader market.
- Price Targets: Analysts set price targets as an estimate of a stock's future value. Comparing the current and prior price targets provides insight into how analysts' expectations have changed over time. This information can be valuable for investors seeking to understand consensus views on the stock's potential future performance.
Assessing these analyst evaluations alongside crucial financial indicators can provide a comprehensive overview of Nike's market position. Stay informed and make well-judged decisions with the assistance of our Ratings Table.
Stay up to date on Nike analyst ratings.
About Nike
Nike is the largest athletic footwear and apparel brand in the world. Key categories include basketball, running, and football (soccer). Footwear generates about two thirds of its sales. Its brands include Nike, Jordan (premium athletic footwear and clothing), and Converse (casual footwear). Nike sells products worldwide through company-owned stores, franchised stores, and third-party retailers. The firm also operates e-commerce platforms in more than 40 countries. Nearly all its production is outsourced to contract manufacturers in more than 30 countries. Nike was founded in 1964 and is based in Beaverton, Oregon.
Financial Insights: Nike
Market Capitalization: Exceeding industry standards, the company's market capitalization places it above industry average in size relative to peers. This emphasizes its significant scale and robust market position.
Negative Revenue Trend: Examining Nike's financials over 3 months reveals challenges. As of 28 February, 2025, the company experienced a decline of approximately -8.78% in revenue growth, reflecting a decrease in top-line earnings. As compared to its peers, the revenue growth lags behind its industry peers. The company achieved a growth rate lower than the average among peers in Consumer Discretionary sector.
Net Margin: The company's net margin is a standout performer, exceeding industry averages. With an impressive net margin of 7.05%, the company showcases strong profitability and effective cost control.
Return on Equity (ROE): Nike's ROE surpasses industry standards, highlighting the company's exceptional financial performance. With an impressive 5.66% ROE, the company effectively utilizes shareholder equity capital.
Return on Assets (ROA): Nike's ROA surpasses industry standards, highlighting the company's exceptional financial performance. With an impressive 2.1% ROA, the company effectively utilizes its assets for optimal returns.
Debt Management: Nike's debt-to-equity ratio stands notably higher than the industry average, reaching 0.85. This indicates a heavier reliance on borrowed funds, raising concerns about financial leverage.
The Basics of Analyst Ratings
Experts in banking and financial systems, analysts specialize in reporting for specific stocks or defined sectors. Their comprehensive research involves attending company conference calls and meetings, analyzing financial statements, and engaging with insiders to generate what are known as analyst ratings for stocks. Typically, analysts assess and rate each stock once per quarter.
In addition to their assessments, some analysts extend their insights by offering predictions for key metrics such as earnings, revenue, and growth estimates. This supplementary information provides further guidance for traders. It is crucial to recognize that, despite their specialization, analysts are human and can only provide forecasts based on their beliefs.
Which Stocks Are Analysts Recommending Now?
Benzinga Edge gives you instant access to all major analyst upgrades, downgrades, and price targets. Sort by accuracy, upside potential, and more. Click here to stay ahead of the market.
This article was generated by Benzinga's automated content engine and reviewed by an editor.
Edge Rankings
Price Trend
© 2025 Benzinga.com. Benzinga does not provide investment advice. All rights reserved.
date | ticker | name | Price Target | Upside/Downside | Recommendation | Firm |
|---|
Trade confidently with insights and alerts from analyst ratings, free reports and breaking news that affects the stocks you care about.

