


Analysts' ratings for Blue Owl Capital OWL over the last quarter vary from bullish to bearish, as provided by 9 analysts.
The table below provides a concise overview of recent ratings by analysts, offering insights into the changing sentiments over the past 30 days and drawing comparisons with the preceding months for a holistic perspective.
| Bullish | Somewhat Bullish | Indifferent | Somewhat Bearish | Bearish | |
|---|---|---|---|---|---|
| Total Ratings | 2 | 5 | 2 | 0 | 0 |
| Last 30D | 0 | 1 | 0 | 0 | 0 |
| 1M Ago | 0 | 0 | 1 | 0 | 0 |
| 2M Ago | 0 | 3 | 0 | 0 | 0 |
| 3M Ago | 2 | 1 | 1 | 0 | 0 |
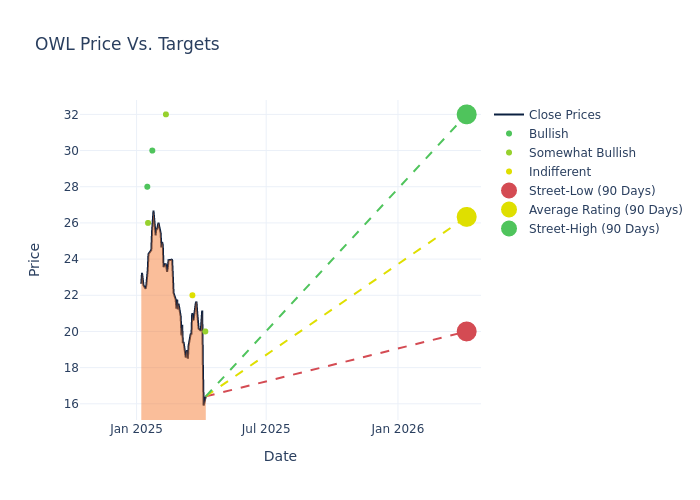
The 12-month price targets, analyzed by analysts, offer insights with an average target of $27.0, a high estimate of $32.00, and a low estimate of $20.00. A 1.06% drop is evident in the current average compared to the previous average price target of $27.29.
Analyzing Analyst Ratings: A Detailed Breakdown
An in-depth analysis of recent analyst actions unveils how financial experts perceive Blue Owl Capital. The following summary outlines key analysts, their recent evaluations, and adjustments to ratings and price targets.
| Analyst | Analyst Firm | Action Taken | Rating |Current Price Target| Prior Price Target | |--------------------|--------------------|---------------|-----------------|--------------------|--------------------| |Benjamin Budish |Barclays |Lowers |Overweight | $20.00|$29.00 | |Michael Brown |Wells Fargo |Lowers |Equal-Weight | $22.00|$24.00 | |Benjamin Budish |Barclays |Announces |Overweight | $29.00|- | |Brian McKenna |JMP Securities |Maintains |Market Outperform| $32.00|$32.00 | |Brian McKenna |JMP Securities |Raises |Market Outperform| $32.00|$30.00 | |Christopher Allen |Citigroup |Announces |Buy | $30.00|- | |Glenn Schorr |Evercore ISI Group |Raises |Outperform | $26.00|$25.00 | |Bill Katz |TD Cowen |Raises |Buy | $28.00|$26.00 | |Michael Brown |Wells Fargo |Lowers |Equal-Weight | $24.00|$25.00 |
Key Insights:
- Action Taken: Analysts adapt their recommendations to changing market conditions and company performance. Whether they 'Maintain', 'Raise' or 'Lower' their stance, it reflects their response to recent developments related to Blue Owl Capital. This information provides a snapshot of how analysts perceive the current state of the company.
- Rating: Analyzing trends, analysts offer qualitative evaluations, ranging from 'Outperform' to 'Underperform'. These ratings convey expectations for the relative performance of Blue Owl Capital compared to the broader market.
- Price Targets: Understanding forecasts, analysts offer estimates for Blue Owl Capital's future value. Examining the current and prior targets provides insight into analysts' changing expectations.
For valuable insights into Blue Owl Capital's market performance, consider these analyst evaluations alongside crucial financial indicators. Stay well-informed and make prudent decisions using our Ratings Table.
Stay up to date on Blue Owl Capital analyst ratings.
About Blue Owl Capital
Blue Owl Capital Inc is an alternative asset management firm. The company deploys private capital across Credit, GP Strategic Capital, and Real Estate platforms on behalf of institutional and private wealth clients. The company conducts its operations through Blue Owl Capital Holdings LP (Blue Owl Holdings) and Blue Owl Capital Carry LP (Blue Owl Carry). Its investor base includes a diversified mix of institutional investors, including public and private pension funds, endowments, foundations, family offices, private banks, high-net-worth individuals, asset managers, and insurance companies. The company generates substantially all of its revenues in the United States.
A Deep Dive into Blue Owl Capital's Financials
Market Capitalization Analysis: Below industry benchmarks, the company's market capitalization reflects a smaller scale relative to peers. This could be attributed to factors such as growth expectations or operational capacity.
Revenue Growth: Blue Owl Capital displayed positive results in 3M. As of 31 December, 2024, the company achieved a solid revenue growth rate of approximately 27.8%. This indicates a notable increase in the company's top-line earnings. As compared to competitors, the company surpassed expectations with a growth rate higher than the average among peers in the Financials sector.
Net Margin: Blue Owl Capital's net margin is below industry averages, indicating potential challenges in maintaining strong profitability. With a net margin of 3.29%, the company may face hurdles in effective cost management.
Return on Equity (ROE): Blue Owl Capital's ROE falls below industry averages, indicating challenges in efficiently using equity capital. With an ROE of 1.0%, the company may face hurdles in generating optimal returns for shareholders.
Return on Assets (ROA): Blue Owl Capital's ROA lags behind industry averages, suggesting challenges in maximizing returns from its assets. With an ROA of 0.19%, the company may face hurdles in achieving optimal financial performance.
Debt Management: With a high debt-to-equity ratio of 1.4, Blue Owl Capital faces challenges in effectively managing its debt levels, indicating potential financial strain.
Analyst Ratings: What Are They?
Analyst ratings serve as essential indicators of stock performance, provided by experts in banking and financial systems. These specialists diligently analyze company financial statements, participate in conference calls, and engage with insiders to generate quarterly ratings for individual stocks.
Some analysts also offer predictions for helpful metrics such as earnings, revenue, and growth estimates to provide further guidance as to what to do with certain tickers. It is important to keep in mind that while stock and sector analysts are specialists, they are also human and can only forecast their beliefs to traders.
Breaking: Wall Street's Next Big Mover
Benzinga's #1 analyst just identified a stock poised for explosive growth. This under-the-radar company could surge 200%+ as major market shifts unfold. Click here for urgent details.
This article was generated by Benzinga's automated content engine and reviewed by an editor.
Edge Rankings
Price Trend
© 2025 Benzinga.com. Benzinga does not provide investment advice. All rights reserved.
date | ticker | name | Price Target | Upside/Downside | Recommendation | Firm |
|---|
Trade confidently with insights and alerts from analyst ratings, free reports and breaking news that affects the stocks you care about.

