


Hercules Capital HTGC has been analyzed by 4 analysts in the last three months, revealing a diverse range of perspectives from bullish to bearish.
The table below provides a concise overview of recent ratings by analysts, offering insights into the changing sentiments over the past 30 days and drawing comparisons with the preceding months for a holistic perspective.
| Bullish | Somewhat Bullish | Indifferent | Somewhat Bearish | Bearish | |
|---|---|---|---|---|---|
| Total Ratings | 0 | 3 | 1 | 0 | 0 |
| Last 30D | 0 | 2 | 0 | 0 | 0 |
| 1M Ago | 0 | 0 | 0 | 0 | 0 |
| 2M Ago | 0 | 1 | 1 | 0 | 0 |
| 3M Ago | 0 | 0 | 0 | 0 | 0 |
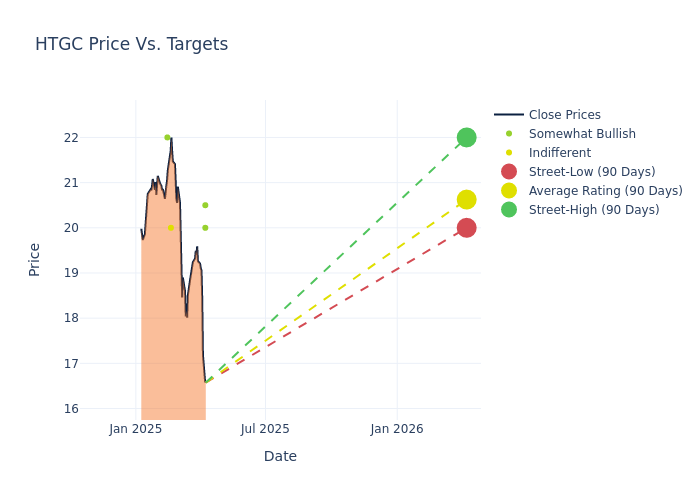
The 12-month price targets assessed by analysts reveal further insights, featuring an average target of $20.62, a high estimate of $22.00, and a low estimate of $20.00. Experiencing a 2.69% decline, the current average is now lower than the previous average price target of $21.19.
Diving into Analyst Ratings: An In-Depth Exploration
A comprehensive examination of how financial experts perceive Hercules Capital is derived from recent analyst actions. The following is a detailed summary of key analysts, their recent evaluations, and adjustments to ratings and price targets.
| Analyst | Analyst Firm | Action Taken | Rating |Current Price Target| Prior Price Target | |--------------------|-----------------------|---------------|-----------------|--------------------|--------------------| |Paul Johnson |Keefe, Bruyette & Woods|Lowers |Outperform | $20.50|$21.50 | |Crispin Love |Piper Sandler |Lowers |Overweight | $20.00|$23.00 | |Casey Alexander |Compass Point |Raises |Neutral | $20.00|$18.25 | |Brian McKenna |JMP Securities |Maintains |Market Outperform| $22.00|$22.00 |
Key Insights:
- Action Taken: Analysts adapt their recommendations to changing market conditions and company performance. Whether they 'Maintain', 'Raise' or 'Lower' their stance, it reflects their response to recent developments related to Hercules Capital. This information provides a snapshot of how analysts perceive the current state of the company.
- Rating: Delving into assessments, analysts assign qualitative values, from 'Outperform' to 'Underperform'. These ratings communicate expectations for the relative performance of Hercules Capital compared to the broader market.
- Price Targets: Gaining insights, analysts provide estimates for the future value of Hercules Capital's stock. This comparison reveals trends in analysts' expectations over time.
Capture valuable insights into Hercules Capital's market standing by understanding these analyst evaluations alongside pertinent financial indicators. Stay informed and make strategic decisions with our Ratings Table.
Stay up to date on Hercules Capital analyst ratings.
About Hercules Capital
Hercules Capital Inc is a specialty finance company that provides senior secured loans to high-growth, venture capital-backed companies in various technology, life sciences, and sustainable and renewable technology industries. It invests majorly in structured debt with warrants and, to a lesser extent, in senior debt and equity investments. The company lends to and invests in portfolio companies in various technology-related industries, including technology, drug discovery and development, biotechnology, life sciences, healthcare, and sustainable and renewable technology.
Hercules Capital: A Financial Overview
Market Capitalization: Positioned above industry average, the company's market capitalization underscores its superiority in size, indicative of a strong market presence.
Revenue Challenges: Hercules Capital's revenue growth over 3M faced difficulties. As of 31 December, 2024, the company experienced a decline of approximately -40.98%. This indicates a decrease in top-line earnings. As compared to its peers, the revenue growth lags behind its industry peers. The company achieved a growth rate lower than the average among peers in Financials sector.
Net Margin: Hercules Capital's net margin excels beyond industry benchmarks, reaching 74.7%. This signifies efficient cost management and strong financial health.
Return on Equity (ROE): Hercules Capital's ROE lags behind industry averages, suggesting challenges in maximizing returns on equity capital. With an ROE of 3.2%, the company may face hurdles in achieving optimal financial performance.
Return on Assets (ROA): Hercules Capital's ROA falls below industry averages, indicating challenges in efficiently utilizing assets. With an ROA of 1.64%, the company may face hurdles in generating optimal returns from its assets.
Debt Management: Hercules Capital's debt-to-equity ratio is below industry norms, indicating a sound financial structure with a ratio of 0.9.
Analyst Ratings: Simplified
Benzinga tracks 150 analyst firms and reports on their stock expectations. Analysts typically arrive at their conclusions by predicting how much money a company will make in the future, usually the upcoming five years, and how risky or predictable that company's revenue streams are.
Analysts attend company conference calls and meetings, research company financial statements, and communicate with insiders to publish their ratings on stocks. Analysts typically rate each stock once per quarter or whenever the company has a major update.
Some analysts publish their predictions for metrics such as growth estimates, earnings, and revenue to provide additional guidance with their ratings. When using analyst ratings, it is important to keep in mind that stock and sector analysts are also human and are only offering their opinions to investors.
If you want to keep track of which analysts are outperforming others, you can view updated analyst ratings along withanalyst success scores in Benzinga Pro.
Breaking: Wall Street's Next Big Mover
Benzinga's #1 analyst just identified a stock poised for explosive growth. This under-the-radar company could surge 200%+ as major market shifts unfold. Click here for urgent details.
This article was generated by Benzinga's automated content engine and reviewed by an editor.
Edge Rankings
Price Trend
© 2025 Benzinga.com. Benzinga does not provide investment advice. All rights reserved.
date | ticker | name | Price Target | Upside/Downside | Recommendation | Firm |
|---|
Trade confidently with insights and alerts from analyst ratings, free reports and breaking news that affects the stocks you care about.

